Equity and other markets review 06.09-09.09
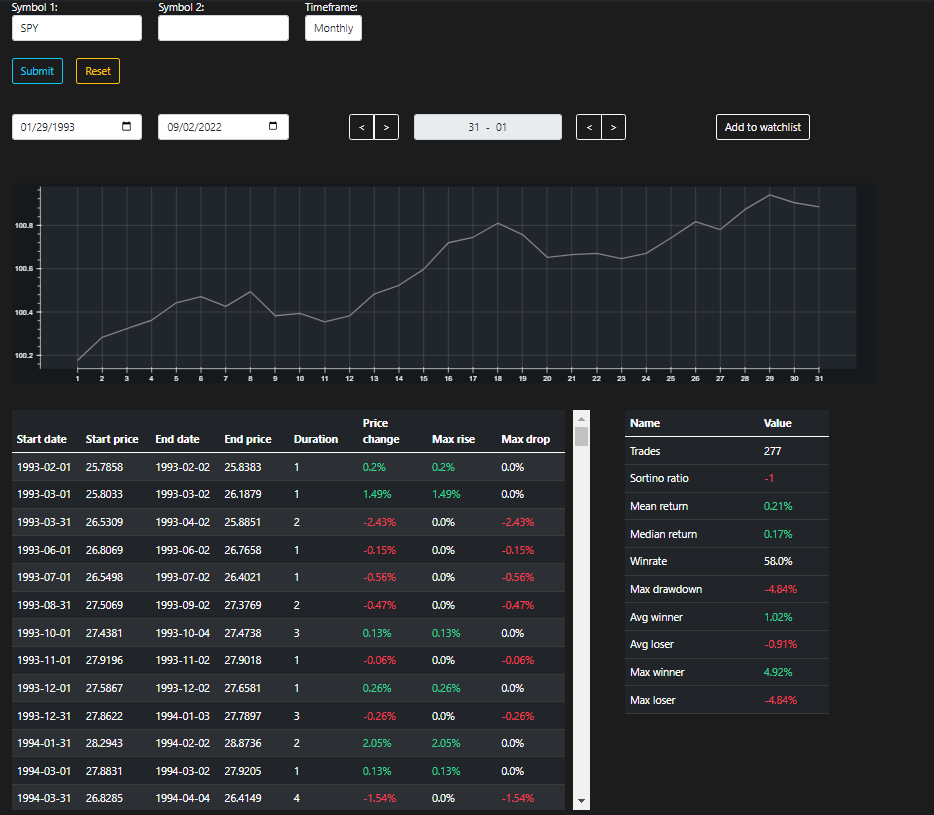
General market overview: Last week SPX continued the momentum on the downside following Powell’s Jackson Hole speech. Lack of bidding was impressive all the way until Thursday, where the sellers were unable to break through the 3900-3925 support area. Turnarounds from oversold conditions post-midday usually present good risk-reward setups when a strong close occurs (as it did). It forms the so called hammer candle, which is a bullish candlestick formation. While I never preach and trade solely on those formations, I have outlined them for anyone who is curious how they have faired in 2022.
Placing the stop at the lows and aiming for at least one 1x the risk is not a sophisticated strategy, yet it has worked 5 out of 7 times this year and 6 out of those 7 times stops would have been more than a day away. Thus, what happened on Friday with larger than expected unemployment numbers caught a lot of people on the wrong foot. I too was a bit surprised, as the first days of the month (much in favor of the 1st day, to be precise) tend to have a positive bias for a long trade, given the typical passive flows that come in action.
Add to this seasonality at the beginning of September and a long weekend for some extra vanna/charm flows and you have a decent positive expectancy for a trade.
And on top, you got larger unemployment numbers than expected, an indicator in a ‘sour’ direction that the Fed has publicly stated to consider when gauging its stance on future pace of rate hikes.
The market has taught me that when there is a good case for a long trade and it quickly and decisively gets refuted, if not ready to switch sides, best action is to wait on the sidelines. And now that I believe we are oversold and near good support levels, I would rather wait for something to ‘tell’ me the right time for a bounce then get short at the worst time and be quickly shaken out of a trade.
The dollar continues its unbothered run-up and rates had a decisive move up on Thursday. Despite the price action on Friday, when the short end got a pullback due to the data, last week was pure damage to the typical 60/40 portfolio with the correlation of bonds and equities being positive. All of this is not bullish for equities, as investors are real people who get emotional when losing money, especially if there is a feeling that there is nowhere to hide, and thus choose to decrease exposure rather than stay invested. Recently stumbled on this chart on twitter, but worth sharing so one can get a perspective of how the correlation between rates and SPX used to be negative (negative correlation between rates and equities = positive correlation between bonds and equities) much more frequently before 2009 than in the last decade. Perhaps we are entering a similar period now where the safe haven bid fails to work out.
Sector performance: There was not much to share about sector performance last week, as everything was in the red.
Uranium was the only sector that stood out in green territory, fueled by the recent catalysts discussed in last week’s letter. One thing I noticed was the outperformance of CCJ, compared to both the Uranium ETF URA and the physical commodity trust U.UN. When/if the time to go long comes, I would rather try the trade with the ‘vehicle’ showing best relative strength.
Another thing we noted last weeks was the expected poor performance of the mega caps. They indeed were extremely weak. NVDA got crushed and fell below the July lows as news banning selling AI chips to China came out. Despite lacking idiosyncratic news, the other generals did not perform much better, with AAPL, MSFT, AMZN, GOOG falling in the range of 2 - 5%.
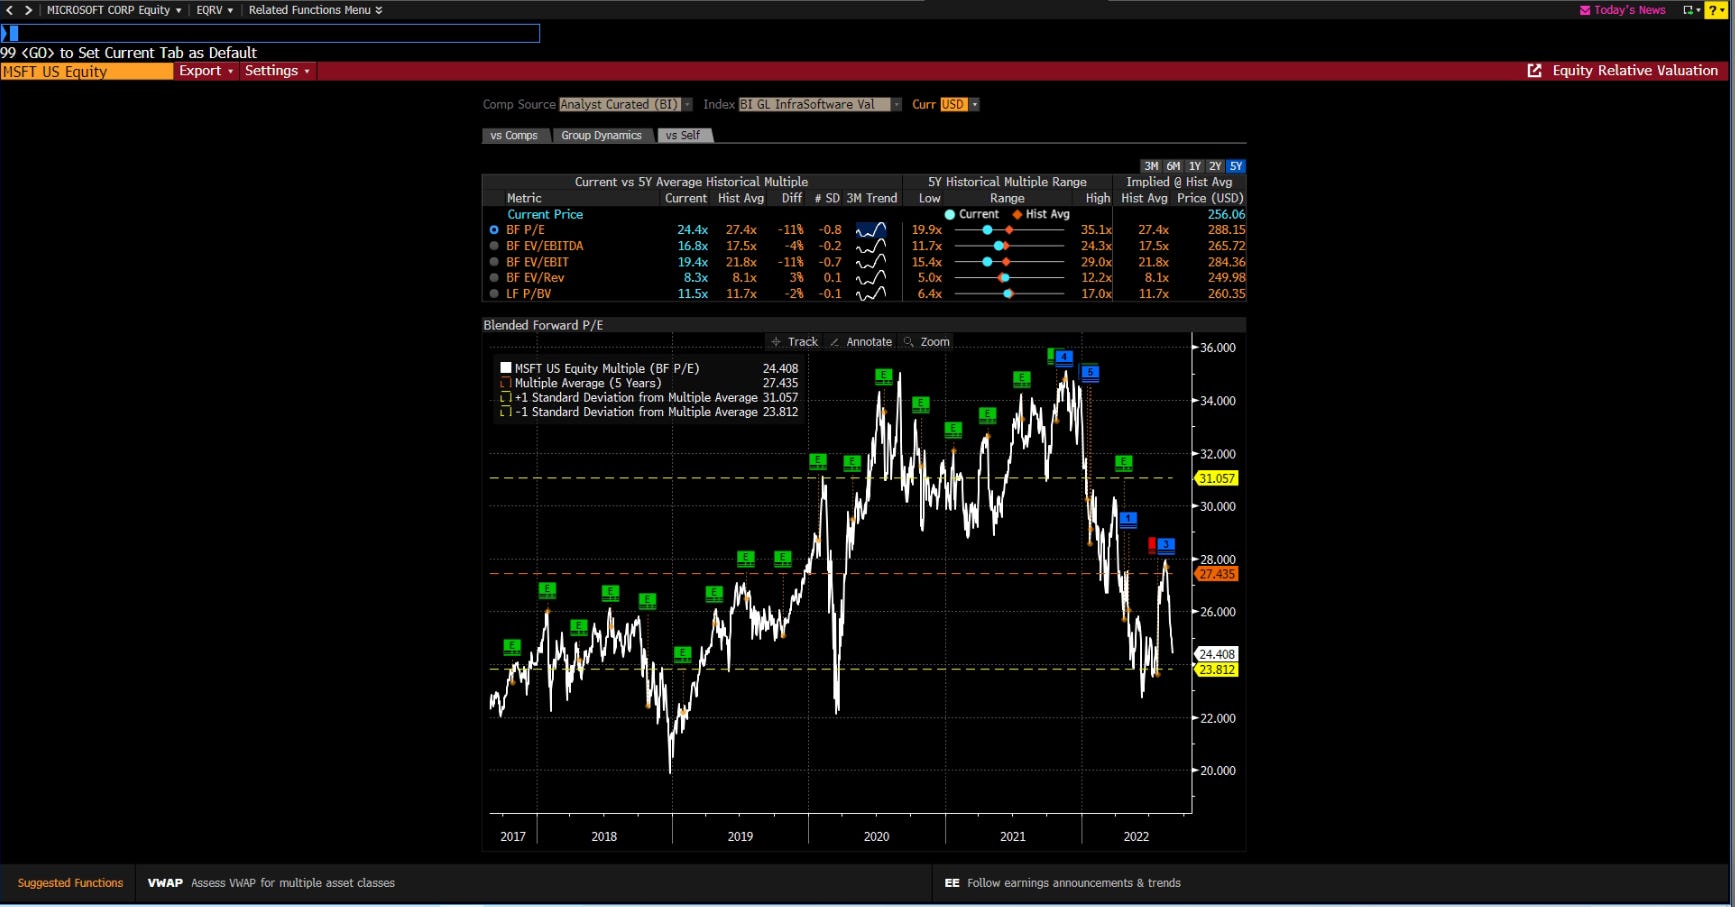
I do believe some mean reversion of the multiples and/or decrease of growth expectations imbedded in the valuations at which AAPL and MSFT are trading is due, and that alone would have a substantial impact on the overall indices’ performance both technically due to skewed weight in them and from a psychological point of view. Common folks share the belief than generals fall last, meaning that when they do fall, volatility/financial chaos is near or already present.
Potential trades: In the process of thinking how to trade that view in the best way possible, I stumbled across the chart of RSP vs SPY. RSP is an equally weighted ETF of the same S&P500 companies on which the SPY ETF is based upon. However, as most of you know SPY follows an index that is market cap weighted, meaning that the weights of the mega caps are much lower in RSP compared to SPY. A quick check shows that just AAPL and MSFT combined are 13% of SPY vs only 0.4% of RSP. And this applies for the other mega caps as well.
The chart is neat with the ratio trading above the important 50,100,200 moving averages on the weekly and appears to be heading out of a small consolidation. Generally, RSP outperforms SPY after severe market distress in what is usually labelled as a reflation trade. One can see that in 2020 the pair dropped sharply before coming back stronger in late 2020. Similar outperformance has happened after Mar 2009 and Feb 2016.
An adequate question here is where is this sharp drop in RSP vs SPY today given that SPY has fallen quite a lot this year. Well, this time around YTD performance has been much worse for the XLK, XLY sectors, where the megacaps are placed, whereas XLP, XME, XLU, XLE have all had a very decent-to-spectucular year. Cannot really complain about the trade working during the somewhat stressful environment we are currently in.
All, things aside, this is just a trade suggestion and if constructed properly with adequate trade management, even if it does not work, it would not hurt too much. One could play it using the ETFs themselves with a stop below the recent consolidation. Or, if one believes we are about to head up/down, capping the short/long through a put/call option would present the benefit of the idea being bust but still making money through riding the general market. If I decide to have skin in the game, I would share the play I have chosen on twitter as I always do.
Current positions: I have taken profit on all of my short positions, have a bit of the short QQQ left and the long-term short in BBBY. Still long oil. Exited my TLT long at a loss.
I have left only a bit of the Sep 30 QQQ 315-295-280 long put fly as we are trading near the body of the structure with not that much time to expiration. This means I am benefiting from time passing by if we hold around current prices. On top of it, as I believe the levels here are bad for new shorts, this tiny bit gives me some mental comfort of not having to chase the market down in case we continue marching lower.
Also, I have not touched the long ratio put spread $11-7 in BBBY, as it is too within the strikes and has a lot of time until it expires in November, so I am leaving that aside for now and will revisit when the time comes.
The TLT trades was built around the turn of the month effect but as rates moved up strongly and the safe haven bid was missing, I decided to ditch it while there was still some premium left in the option structure.
Our long in oil has not performed well either, as the commodity has rejected the sma50 on the daily and is now back at support. Already smelling fishy to me, but would wait to see if it breaks support to take further action on the trade.
Conclusion: The markets seems to lack serious bidding even at good support levels, which is not too optimistic for the bulls. But going short here is not a trade I would take either, which leaves me with the solid but not that exciting option to wait on the sidelines. I believe the price action will ‘tell’ me what the next trade would be, but what I am looking for is a couple of failed attempts to break decent support levels so I get more confident for a decent bounce. This week we have the ECB rate decision, ISM Non-manufacturing index and Initial jobless claims with J. Powell speaking early on Thursday, so plenty of catalysts that could move markets.


