INTRA WEEK PORTFOLIO UPDATES AND A TRADE WALK THROUGH
3.30.2023
It is time for the intra-week portfolio update. It is a busy week for us with several trades under our belt already.
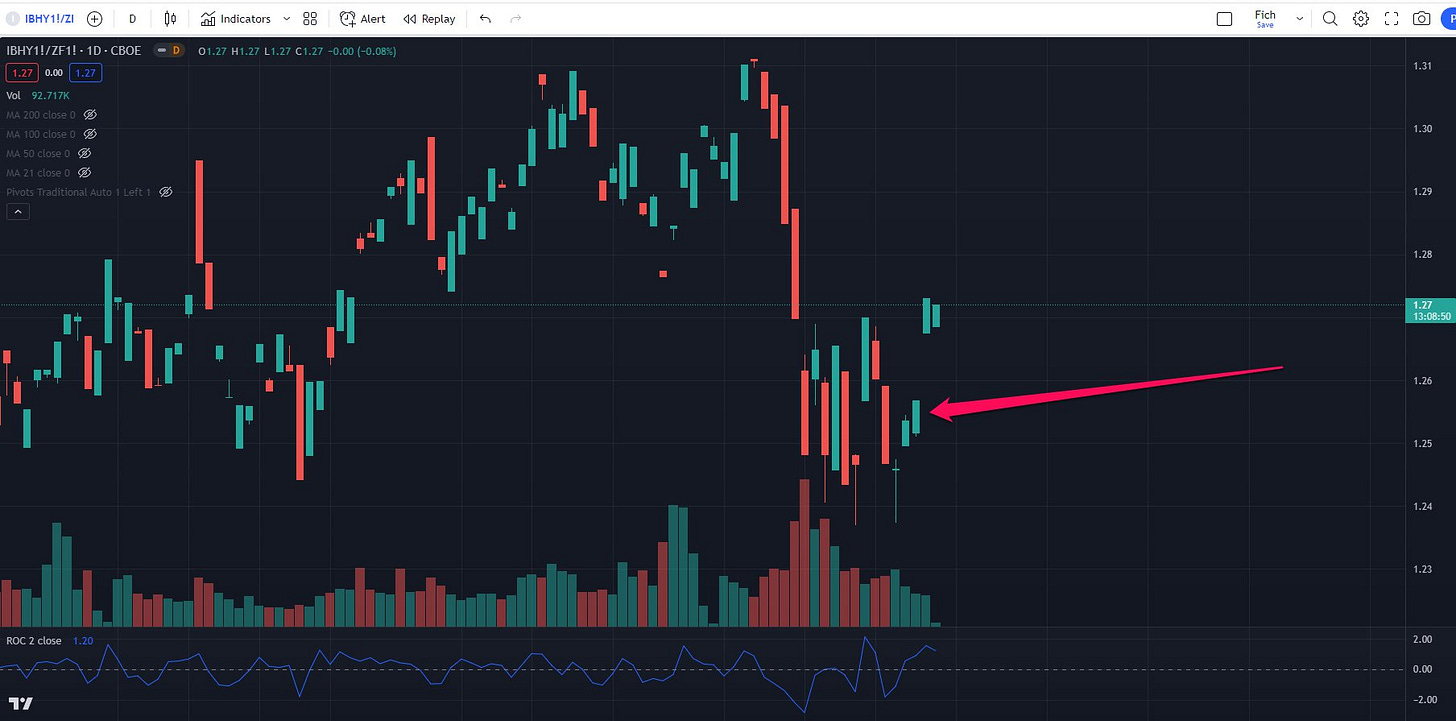
I am a believer of the quarter end window dressing in particular assets. Most times this period leads to drop in volatility , especially in the credit markets, but this time the MOVE index was on the moon prior to this period and I had a strong conviction that the trades will be exceptionally good this quarter end. There is much room for the MOVE index to drop and so many oversold credit instruments that the issue is whether one wants so much exposure on his books rather than opportunities lacking. I was betting on the long-end dropping via TLT short (in my cases UB_F futures) and tightening of credit spreads in high yield bonds, expressed via HYG vs IEI (with futures IBHY vs ZF) . I had written about both trades in the weekend reviews and they were available to our private subscribers.
We have initiated both trades early this week and we are now reaping the rewards.
Getting these alerts on time is crucial. I urge all private subscribers of our Substack to take advantage of the private Twitter feed and enable their notifications for our account in order to avoid missing timely entries and exits.
What else did we do so far this week?
We got into several new trades and sold one existing trade.
IBHY (high yield futures) vs ZF_F duration hedged. Still holding the trade and I expect to hold at least into the first week of April.
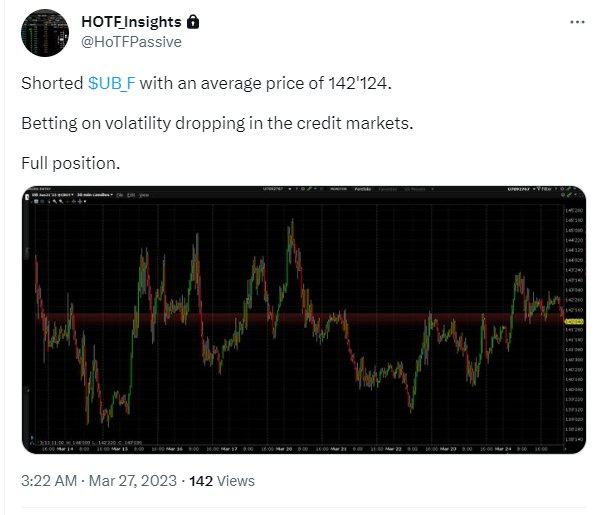
Shorted UB_F and already sold 2/3 of the position. Holding the rest for now as I believe we can test 136-137. The initial short was with a full position. Now that the position is light I wouldn’t mind holding longer.
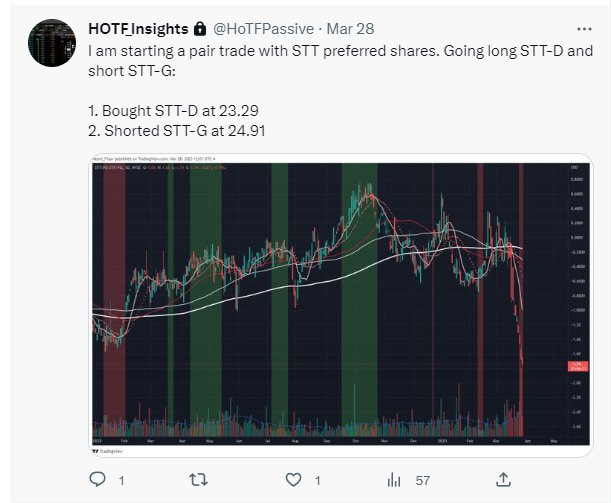
We found an excellent preferred stock pair trade:
Long STT/PD vs Short STT/PG at -1.62. Certainly not as popular as the futures and ETF trades but risk adjusted wise these pair trades are phenomenal and on top of it they don’t care about where the market is. This is not a directional trade. There is a large seller in STT/PD, likely an institution unloading a client’s holding of this preferred stock. Patience is required until the seller in STT/PD is taken out. Until then the trade will hovering around those levels in the -1.80 to -1.60 regional.
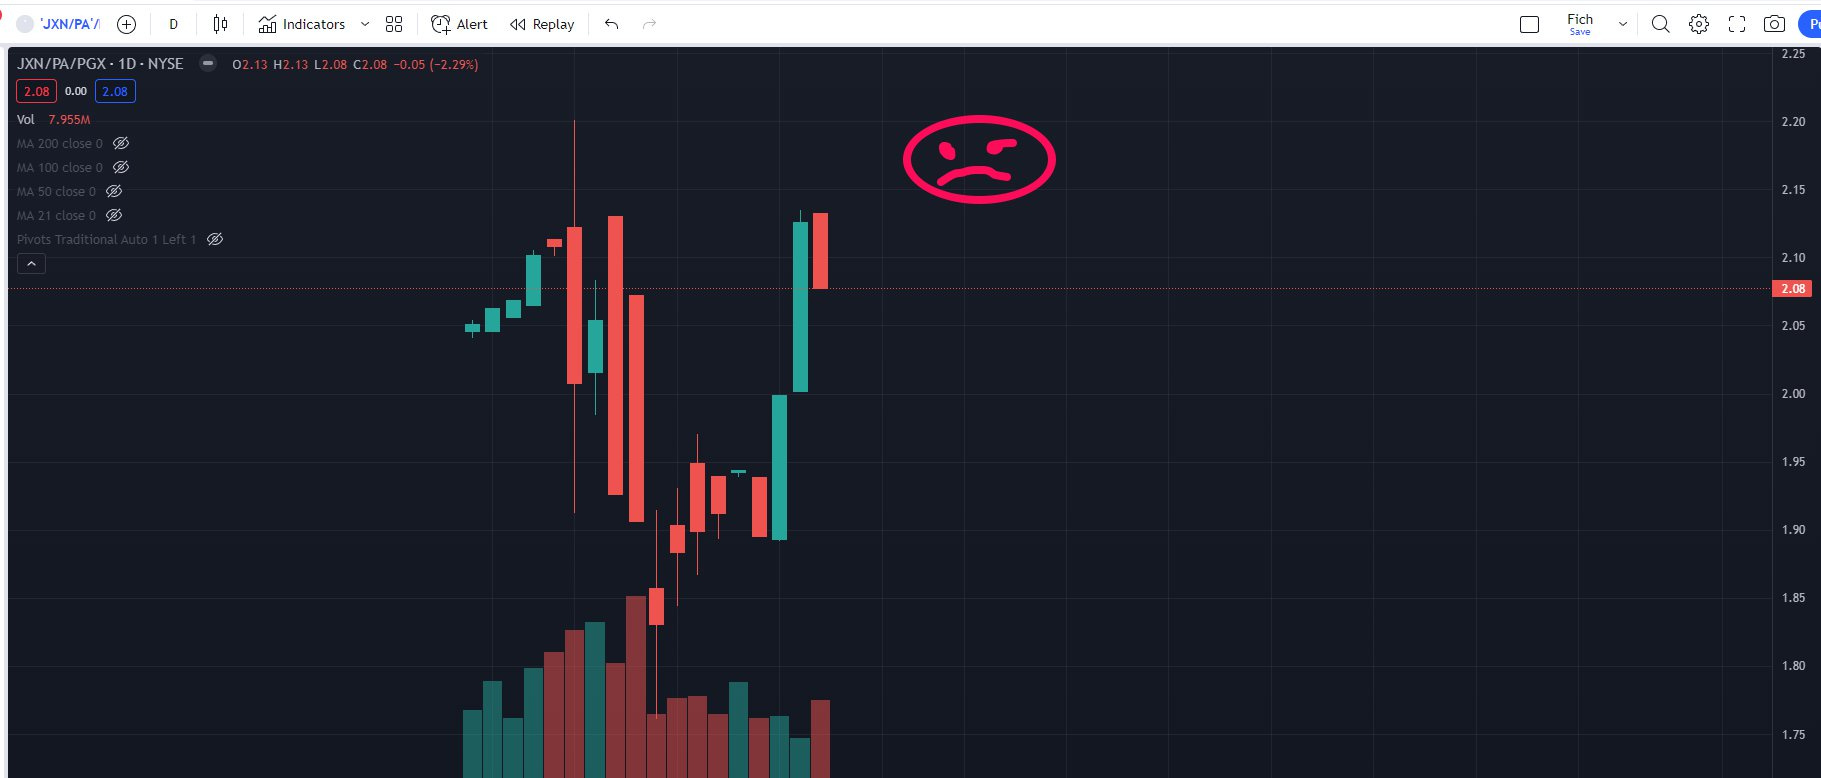
4. I made the decision to sell our JXN/PA (previously JXNFL) vs PGX position. There is the risk of banking fears returning after the quarter end window dressing is over and I don’t want to run the risk of selling into a stressed out market. There was a relentless buyer in the last few days and I took the opportunity to get rid of the position flat (well at a relatively small loss when you account for the dividend paid in PGX and the borrow fee in PGX but still very acceptable given the potential risks).
Unfortunately I didn’t have the nerves to hold further and this trade could have turned into a respectable winner. I keep saying to myself that we can’t catch them all, right?
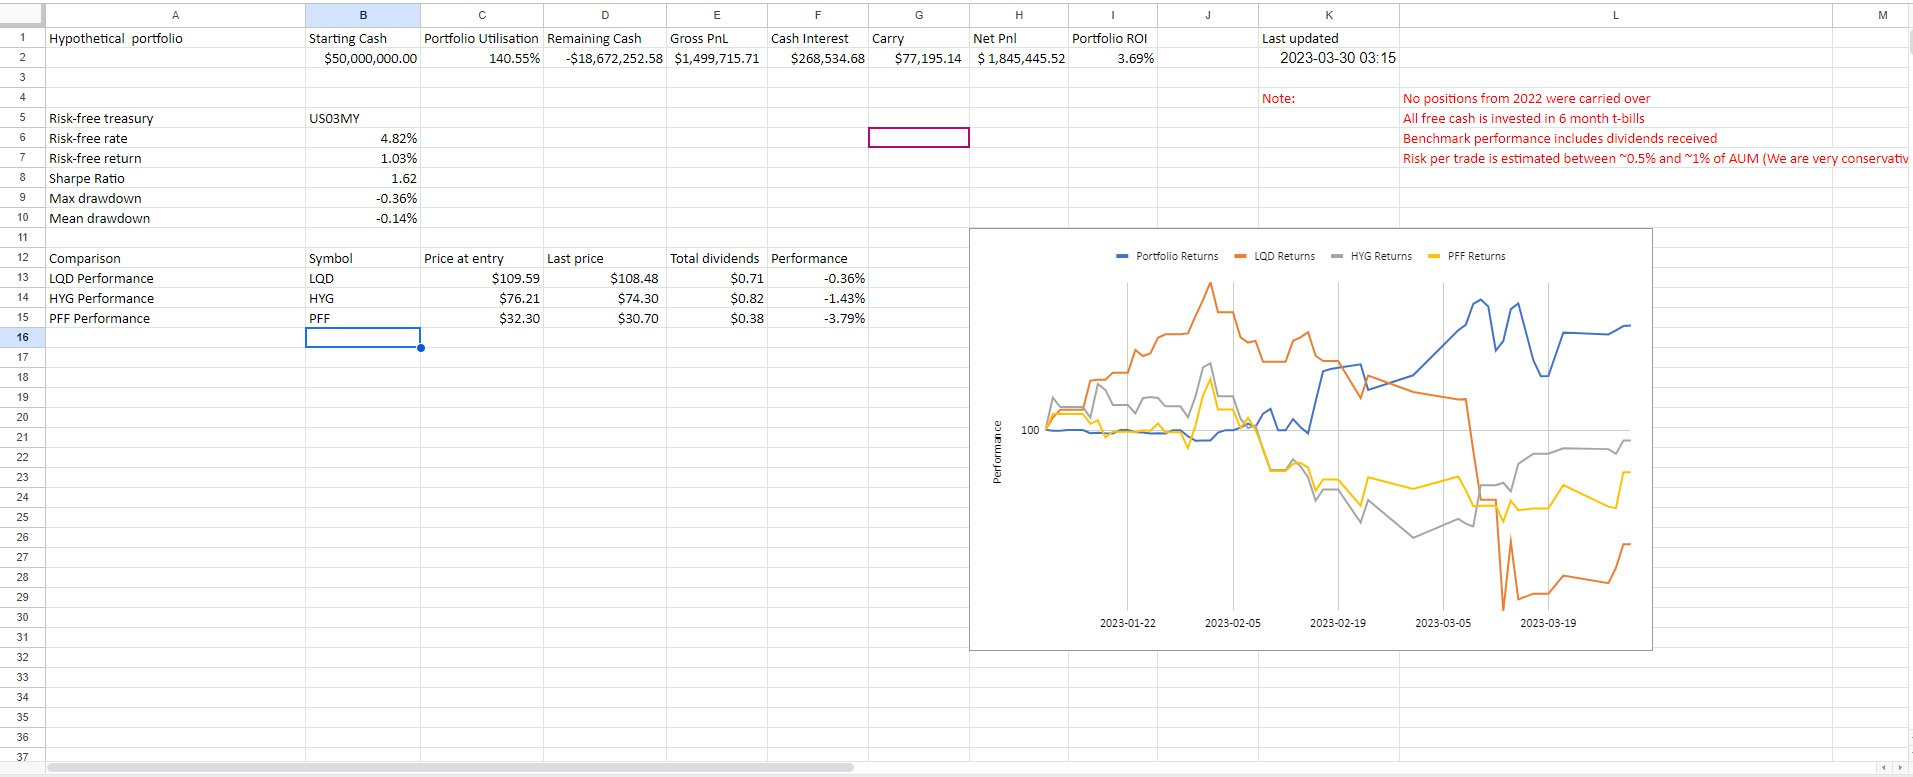
A recap of the portfolio so far.
Still outperforming the fixed income benchmarks. I should note that we are not aggressive with our position sizing and the max we take is 1% of AUM but the vast majority are at 0.5%. Sometimes the instruments are not liquid enough for a large positions, other times the market environment might be unnecessary volatile for extra risk. Either way we are looking for superior risk adjusted returns rather than outsized returns achieved via large drawdowns. This is not our style and you shouldn’t expect large PnL swings.
ONTO THE OPTIONS TRADE WE LIKED.
Last week we discussed the basics of options trading and now I am going to dive deeper into a particular strategy and a trade that we initiated on our trading floor using this technique .
Our followers expressed their interest in options already, so my plan is to start sharing more options trades with you.
TODAY’S TRADE
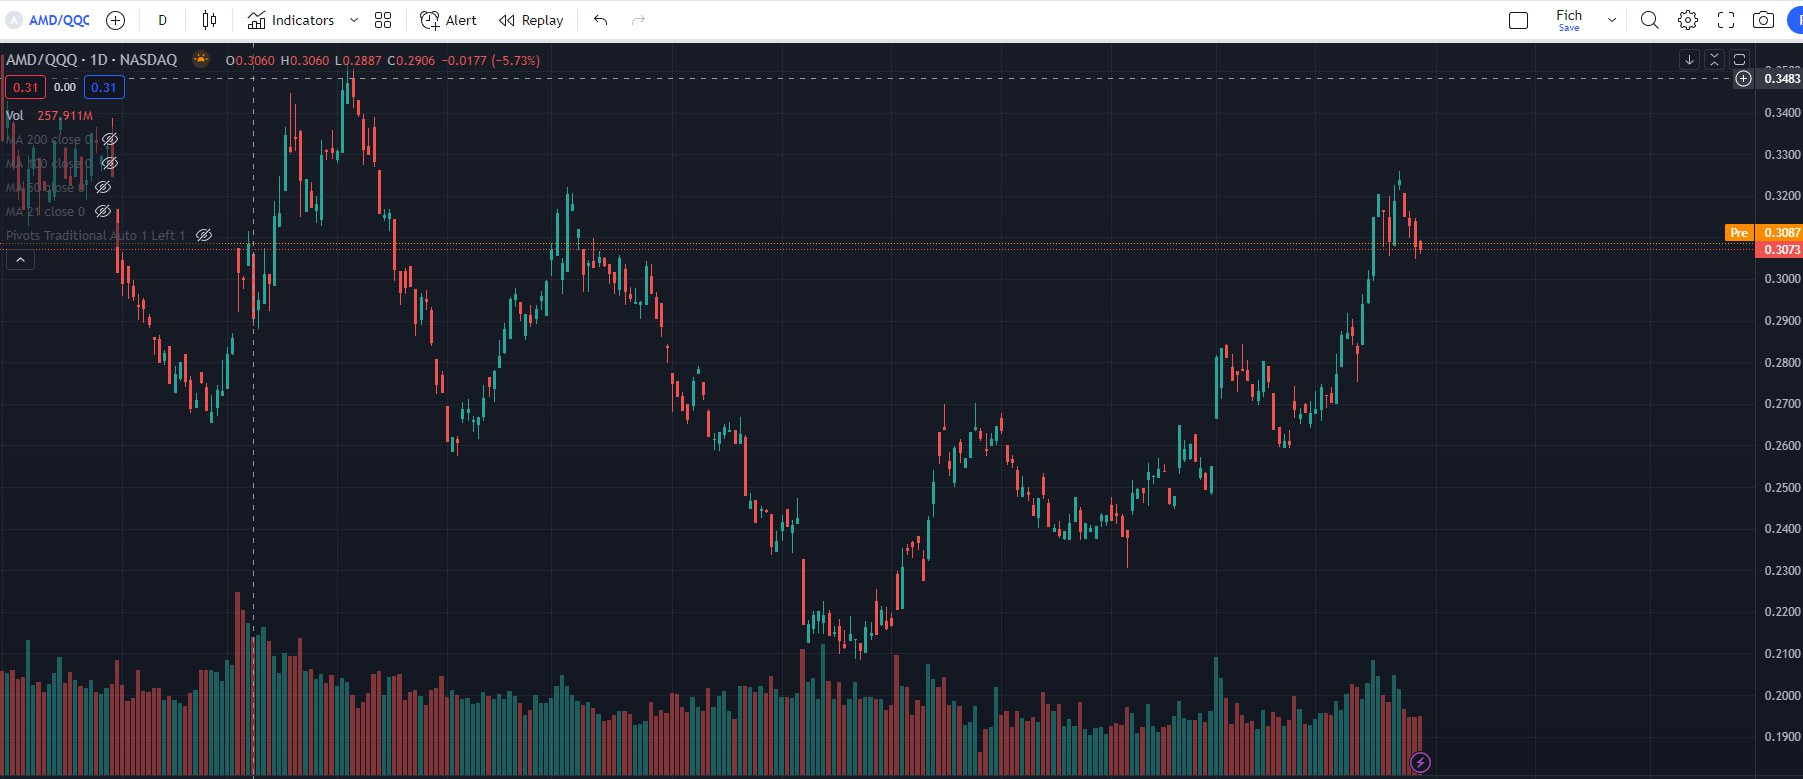
Today's idea is a long put vertical on AMD 0.00%↑ . We wanted to be short for several reasons. We targeted the large cap technology companies as we believed they had a wild run without any reasonable correction. The trade is not really a doomsday scenario trade but rather betting on a technical pullback in the tech sector via picking individual names for their better risk reward profiles to the short side. By better risk profile I mean symbols that had a larger run than the QQQs and are sitting at better technical levels. AMD outperformed QQQ throughout the tech run in the 1Q of the year.
Why we picked to short tech trade:
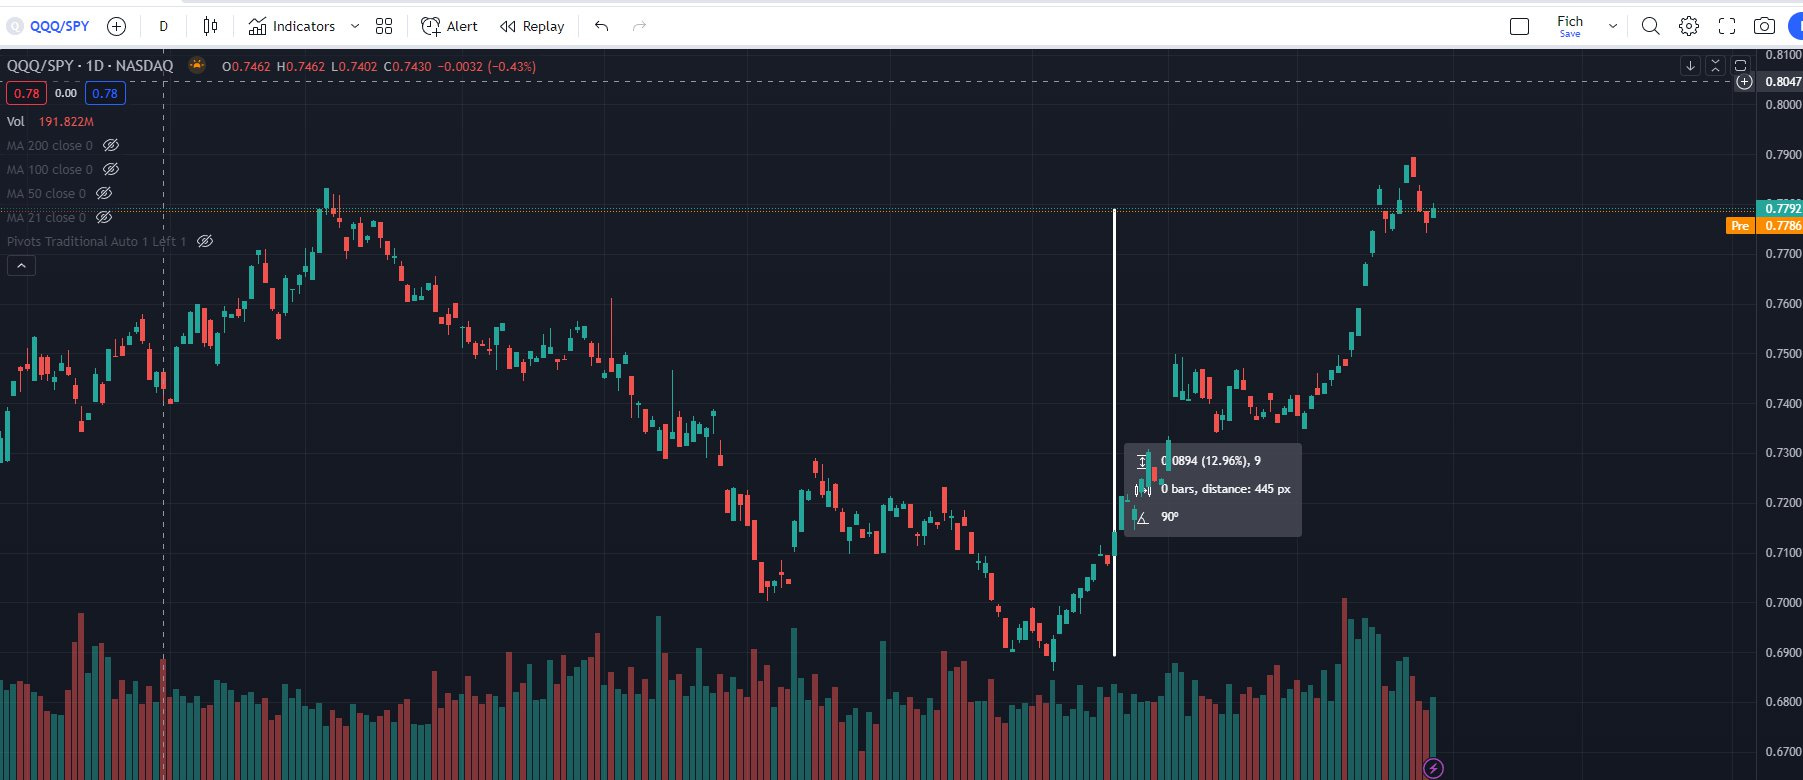
Tech outperformed SPY and DIA by a substantial amount in a short-period of time without any reasonable pullback. Nearly ~13% outperformance in the span of 3 months.
This could serve as a natural hedge against a credit spread tightening spread if the market decides to sell off. It didn’t work in the banking crisis episode we had in March as rates dropped dead, which helped tech’s bid but nevertheless it should should we see further volatility, especially at the current price levels.
So we wanted to have short exposure in large cap tech and we were looking for a way to get it but before that lets remind ourselves some of the options basics. If you are experienced in options trading you could skip this part. It is meant for traders that are starting out as options traders.
First, let me introduce you to vertical spreads.
Personally, this is one of my favorite trading strategies because it's easy to understand, simple enough to implement and with a predefined risk: reward profile.
It's a popular technique that involves buying and selling two options with the same expiration date but different strike prices. There are two main types of vertical spreads: call spreads and put spreads.
The key difference between the two is whether they are bullish or bearish strategies.
A call spread is a bullish strategy that involves buying a call option with a lower strike price and selling a call option with a higher strike price. The goal is to profit from a reasonable increase in the underlying asset's price. You may use a call spread if you believe the underlying asset will rise in price
On the other hand, a put spread is a bearish strategy that involves buying a put option with a higher strike price and selling a put option with a lower strike price. Obviously, the intent is to profit from a decrease in the underlying asset's price
You can either buy verticals or sell them, but in this article, I will focus more on long verticals meaning that you need to buy the spread to implement the idea. Generally, buying spreads offers a higher delta and better RR.
So far so good, but I guess you are already asking yourself: why should I buy a vertical instead of just going with a long call or put?
Here are some reasons why a vertical spread can be a good tool in your arsenal:
Risk management: A vertical spread is a limited risk strategy, which means that the potential loss is limited to the premium paid for the options. This makes it an attractive strategy if you want to leave the trade overnight.
Lower cost: it is less expensive than buying a single option outright, which can be an advantage for traders who have limited capital.
Less theta decay: Because two options are involved, the effects of theta decay on the long option can be offset to some extent by the effects of theta on the short option.
Less vega exposure: changes in implied volatility will affect both options in the spread to a similar degree, which can help to mitigate the impact of volatility on the overall position
Reduced volatility risk: Because a vertical spread involves buying and selling options, it can help to reduce volatility risk. This can be an advantage for traders who want to minimize their exposure to sudden market movements.
As with anything in trading and life, there is also a disadvantage.
The biggest issue with verticals is the limited profit potential. If you are a trader who is looking for uncapped large gains, you may not find this strategy particularly attractive.
Now that you better understand the theory, let's focus on a real-life example.
As mentioned above, I am sharing a trade that I did on AMD. The strategy that I used is long put vertical with expiration on 14th April and with strike prices 97-92. Often you are going to see this type of trade described in the following way:
BOUGHT 14APR23 97/92 PUT VERTICAL
In this case, I bought the 97 put for $4.30 and sold the 92 put for $2.49. Essentially this means that I paid $1.81 per contract.
My risk is limited at $181 per contract making the trade easy to hold even through volatile periods. If you are ready to risk the full premium paid, you can sleep easy even if there was a black swan event. Beauty.
However, when talking about the limited risk, we should also mention the limited profit potential. Since the spread is $5 wide, this means that the max profit per contract could not exceed $319:
5.00 - 1.81 = 3.19 x 100 = $319
Also, it's important to mention that max profit could only be reached at expiration because in order to get it, you need to wait for the short option to expire worthless.
As of this writing, the position is at a small profit and this is how it looks in the options chain:
Why AMD?
I initiated the trade just after the FOMC meeting. The meeting could be labeled as dovish, however I don't think it met the expectations that were growing in the days before it. No rate cuts this year and possibly one more hike in May. Not the best scenario for tech stocks.
AMD was overbought on many technical indicators and was trading just below the resistance level at 102. Also, there is the round 100 number which could serve as a psychological barrier.
The stock was trading at 3 ATR, at the upper Bollinger band, with overbought stochastic and RSI, hence a mean reversion move could be expected. The day finished as a bearish candle with a big wick above it which implies that the bull run was weakening.
Similar technical logic applied to its respective sector $SMH and the overall market ($QQQ) as well - bearish candles with resistance just above the close.
I am looking for a retracement to the 0.382 fib level that sits just above the 10sma currently. Not a major pullback if you consider the average true range of the stock.
Of course, it's not the perfect strategy and it has its drawbacks. Occasionally you will see your stock doing exactly what you predicted but a little too soon and you will not get the profit you expected. You would wish you had a higher delta on your put spread and you keep wondering why you didn’t short naked AMD. This is the life of the options trader. Always juggling between picking the best expiration, picking the best strikes and the best way to construct an options position. You will get it right sometimes but more often than not you will get it wrong. There are too many variables to account for. My preferred way is to usually give myself more time as this naturally increases my chances of success but I am well aware this action reduces my delta and risk to reward as it take time to fully materialize the spread. However, on the positive side, your position is more protected in case the price goes against you and you will experience less theta decay allowing you to wait patiently for your idea to develop. Another positing outcome of expressing trade ideas via options is the fact that you know what you could lose at any given time. (if you are long premium, which we are) This allows for very precise position sizing which is key for maintaining a stable equity curve. You always know the size you need for a trade in order to avoid any outsized losses in your equity curve.
But this is not all, in the world of options a trade is not as black and white as described by the options performance graphs. You don’t need to wait until expiration to realize your profits as the price of the spread goes up and down in value depending what the delta on your position is. But as many of us do, we can focus also on the intraday price action of the stock and figure out for ourselves if the trade is invalidated by seeing a daily close above the resistance line. This event may happen prior to expiration and I will use it as a stop. A close above 103.50 for example would be enough for me to reconsider my point of view. Therefore you can have an even tighter stop than initially planned which would contribute to further improving your equity curve by reducing potential losses significantly while letting your winners run.
As traders we never look at options from a black and white perspective. We always consider the current market sentiment and price action of the stock we are trading. Being active in your trade management allows you to be in control of your trading and squeeze in better risk to reward metrics from each trade. This is exactly what we are trying to explain in this case. In our example above we have a maximum loss of $181 per contract but I could easily get out at only $80 loss if I wish to do so while keeping myself open to the max profit of $319 per contract which would improve my risk to reward ratio to ~1:4. Looking at options trades in this manner will help you take significantly more trades as you know the risk is worth it.


