WEEKLY BOND REVIEW
CPI week is finally here. It goes without saying that it will be the catalyst for the next move. Which direction it would go is anyone’s guess and whoever claims to know the outcome is a charlatan. If you look at the markets from my short-term glasses, you would not find much reason to trade the CPI release in any shape or form. With equal success you can play the roulette. But this time I think it is different. And that is because the positioning of the credit markets had been so bullish, that there is very little room to the upside. Credit spreads are at their tightest, some reaching levels from Apr’22. Spreads between the BBBs and BB in Europe are also at their tightest in more than year. Given what happened in 2022, I think we are at absurdly tight levels. It feels as if we are priced to perfection. But things are moving under the surface. Terminal rate expectations crossed the 5% mark again and are sitting at the upper range , alongside with the Dec’23 and Jan’24 FFR futures. If inflation comes in lower there will be a pullback from the highs, but I expect to be temporary. It feels like the market wants to project higher rates, it feels like the FED members and ECB members are really doing their best to warn us but no one is listening. Risk assets are still in a ‘pivot’ mode. And truth be told, they may be right, who am I to say we are stretched based on a trading experience alone and valuations. But looking at the charts I can’t talk myself into buying credit or equities at the top , after such a huge move.
Chart below shows Jun’23 - Jun’24 Eurodollar futures. It clearly shows the higher for longer is now getting priced in , wiping out 50bps in cuts until Jun’24.
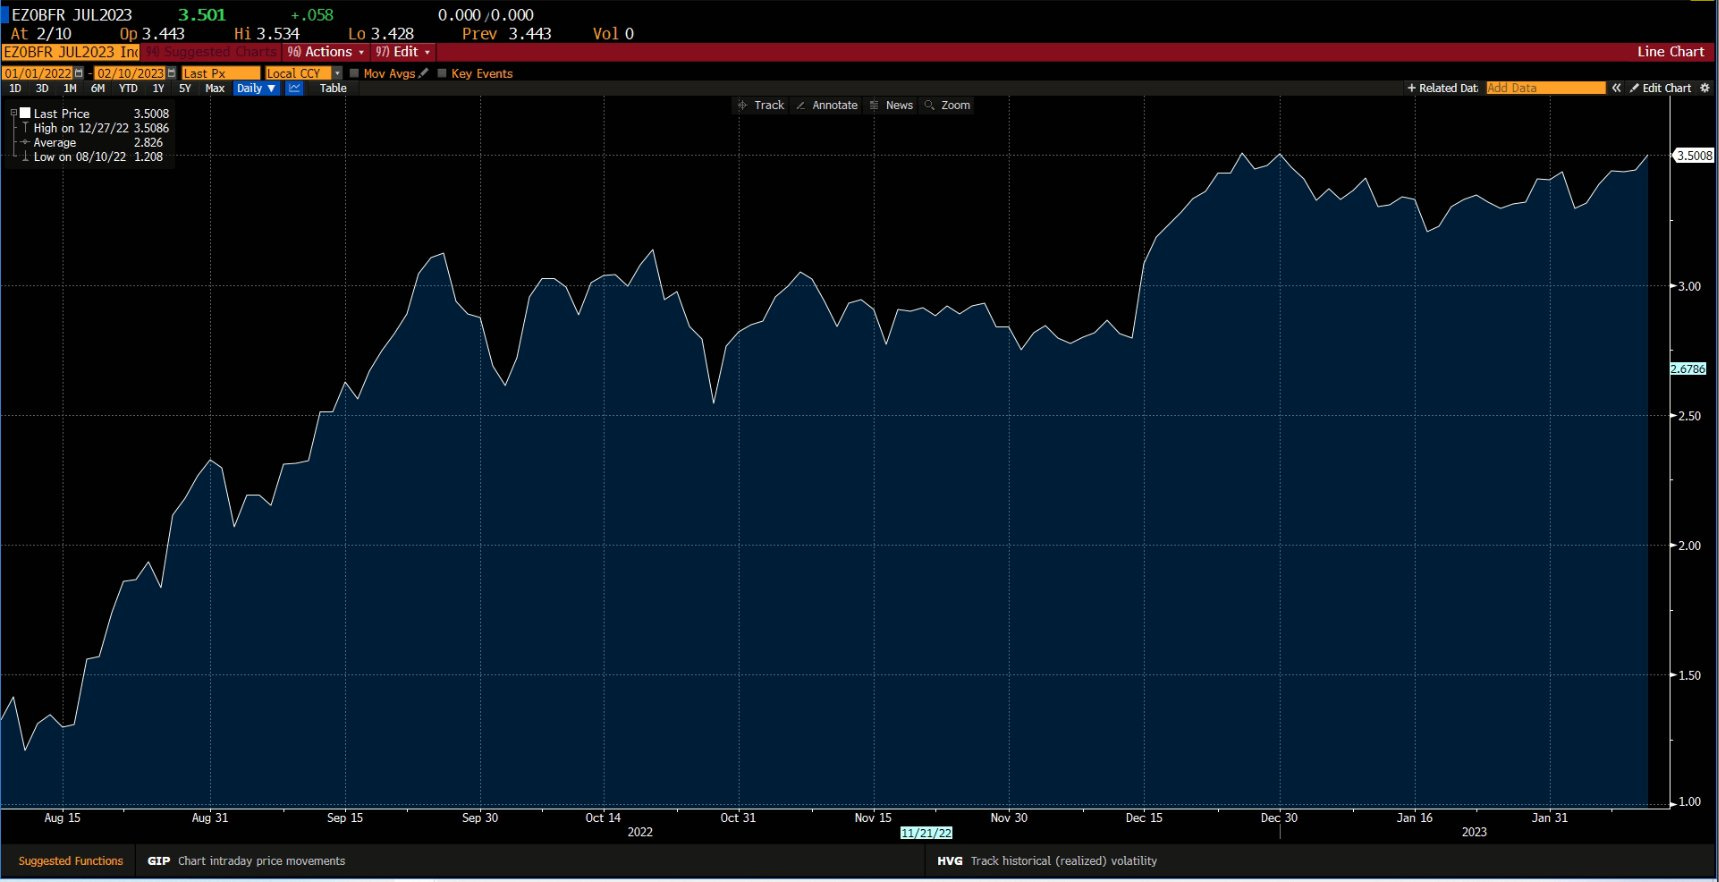
Europe’s OIS priced at the upper range of 3.5% as well.
I should point out that these are just projections and it is clear the market is not trading based on them at this moment. This is simply interest rate traders trying to predict what will happen in the near future. I have no idea if equity and credit traders take this information into account and whether they look at it at all. Maybe equity markets can work well on 5% terminal rate and +25bps/-25bps wouldn’t make a difference. Maybe if we go to +6% terminal rate Mr. Market will finally wake up and say “Ouch”. I have no idea, this is me rumbling about the state of the credit and equity markets while trying to make sense of it. One thing I know for sure, I don’t want to buy new positions at current prices. Chart wise there is not much room to the upside. In order to continue we should go through a pullback or a consolidation first. Only when that happens, I will look around for longs or in my case , get rid of the ETF hedges I have on.
THE ETFS:
PFF - We finally saw a pullback. It was to be expected. Currently down 2.8% from highs. Should we see a more consistent sell off, the $32 level should be the next stop. Until that happens I am not going to do anything in regards to our positions that use PFF as a hedge. So far the hedges are working very well and making us more money than we are down on the longs, all the while we are collecting a very heft interest on a daily basis.
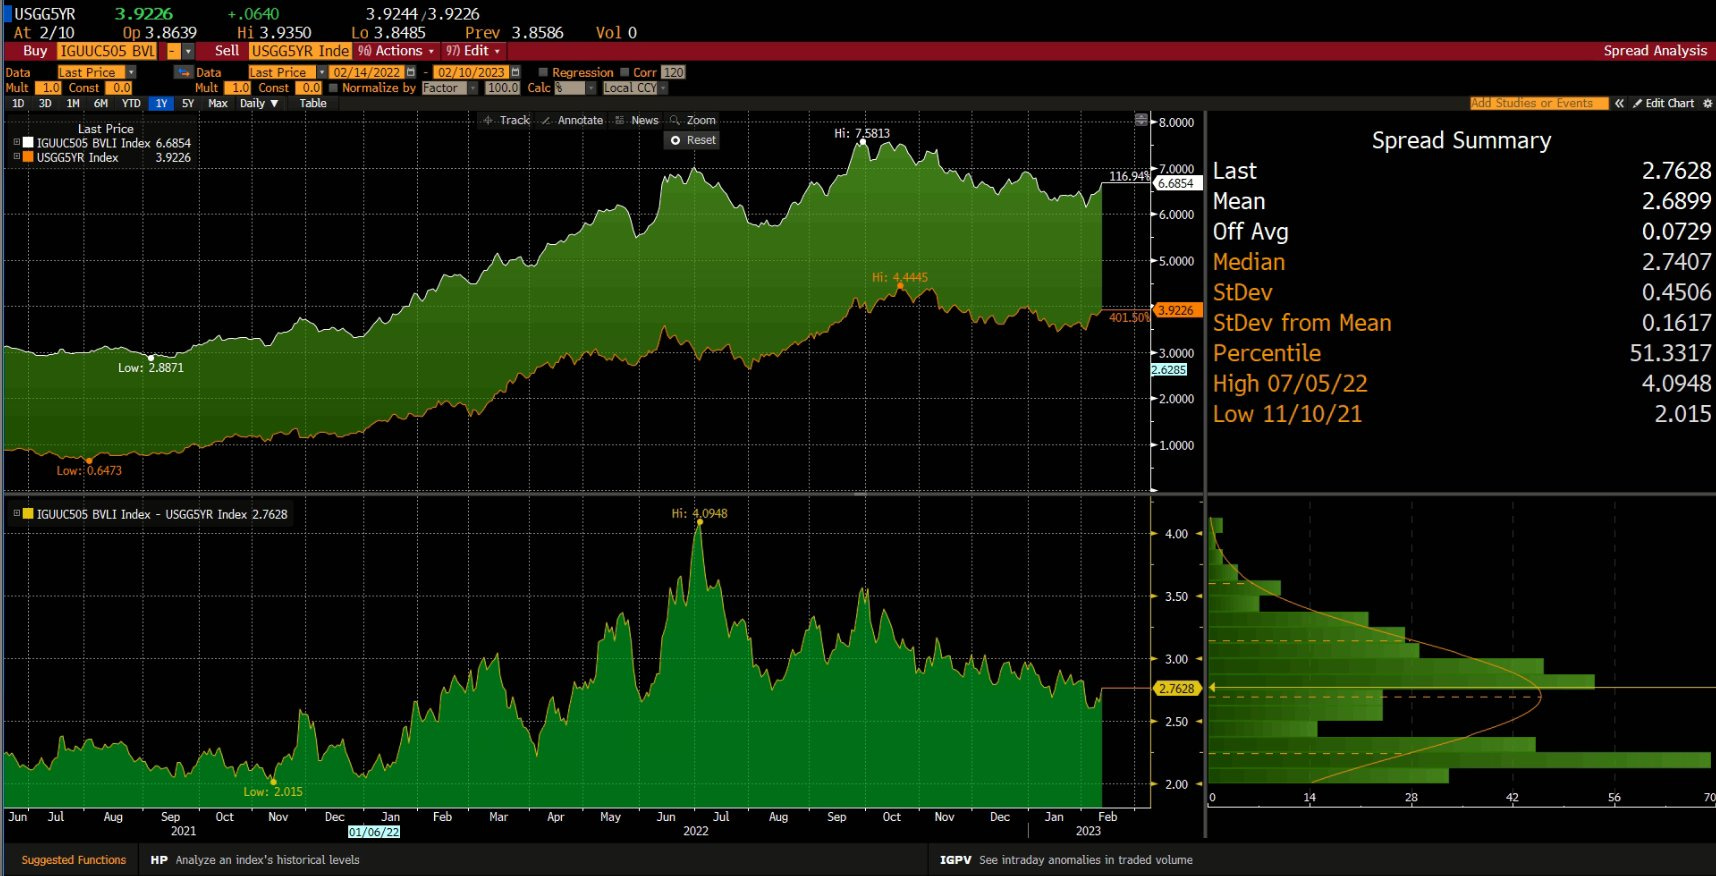
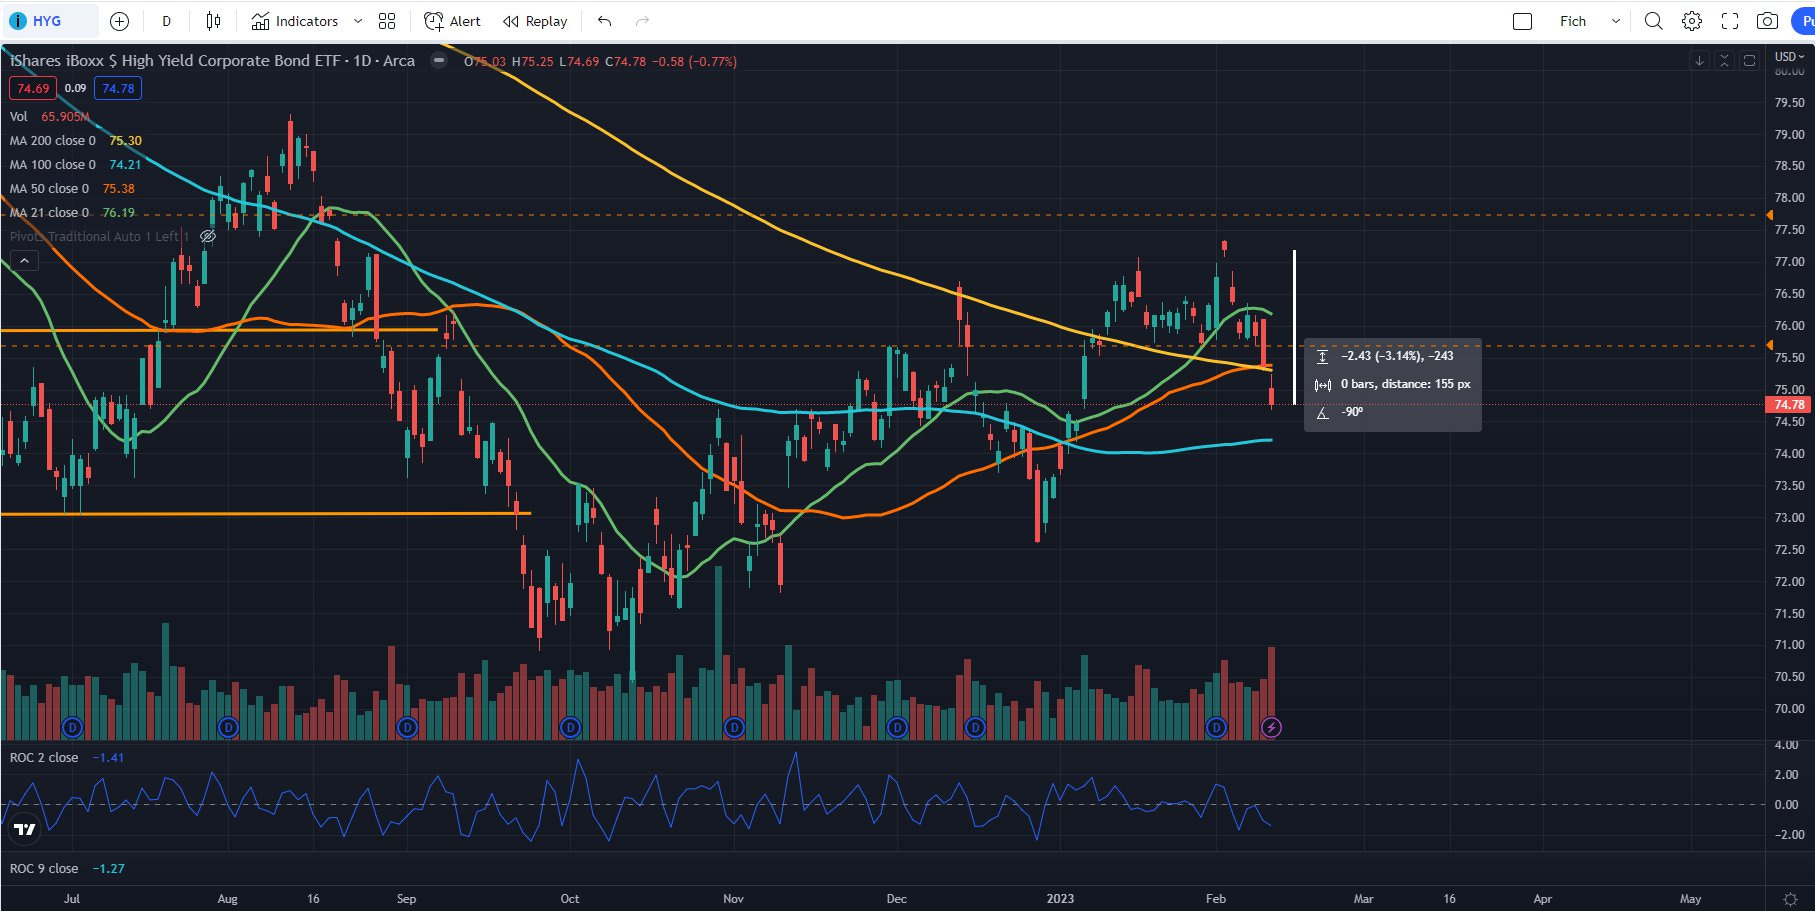
HYG - Down by 3%. New high yield issues are getting priced in the +7% yield category which is getting relatively tight, especially given where terminal rates are being priced in as well as where the 5y and 10y yields are trading. This means tight spreads. US05Y - US BBs 5 year yield is sitting at 2.7%
POTENTIAL TRADES:
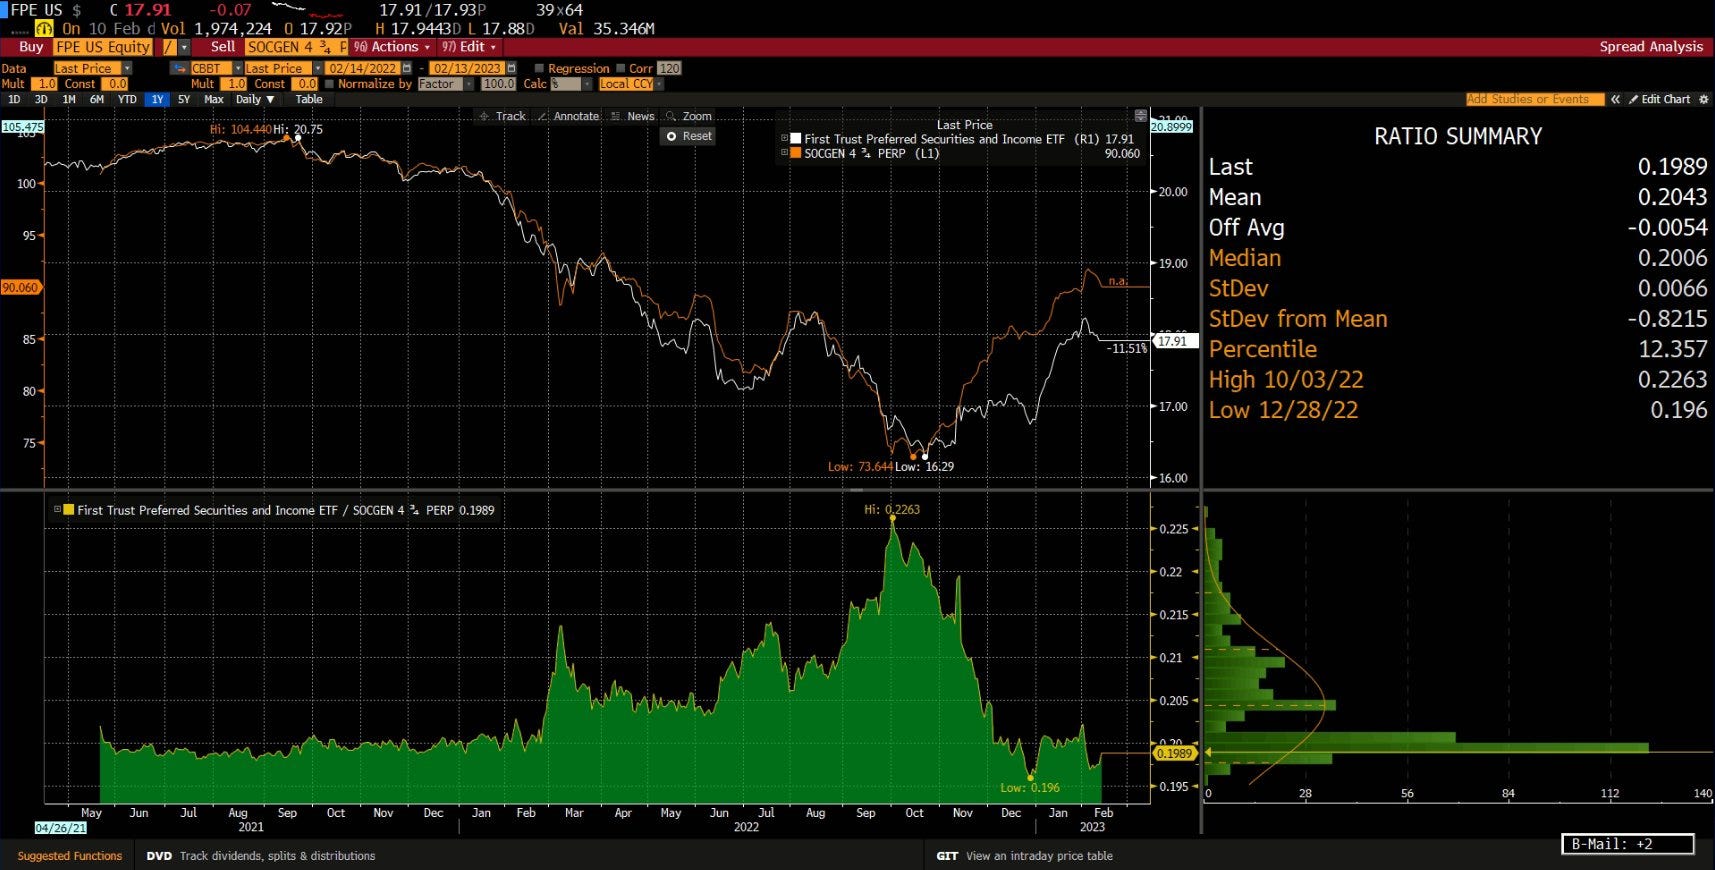
A quick note on the ratio charts below. A ratio chart is simply a chart showing the performance of one asset over another in percentage terms. The number on the y-axis shows the price of asset A divided by the price of asset B. That is why it is called a ratio chart. The symbol on the left is always the long symbol, whereas the symbol on the right is always the short symbol. Having that, if a ratio chart drops , the long asset underperforms the short asset. If the ratio chart increases in value the long asset outperforms the short asset. That is how I identify if a certain product is under/overvalued compared to benchmark ETF. Should be noted that the charts do not take fundamental information into account. For example, a callable product might be trading near to par and to skew the chart. An idiosyncratic news can hit one of the assets and skew the charts. Point is, you always need to know what you are buying and what you are selling. Then, in equal circumstances you check if a particular product that you like to buy is undervalued also to peers and sector rivals.
What you benefit from trading pairs compared to outright directional exposure:
Better risk adjusted performance.
Directionless trading. You don’t care whether the market will go up or down, you simply wait for the potential outperformance of one of the instruments.
You can trade larger size due to the better risk adjusted performance
There is one big negative though:
Takes 2x the capital therefore to be able to scale this strategy you need a lot of capital.
ONTO THIS WEEK’S POTENTIAL TRADES:
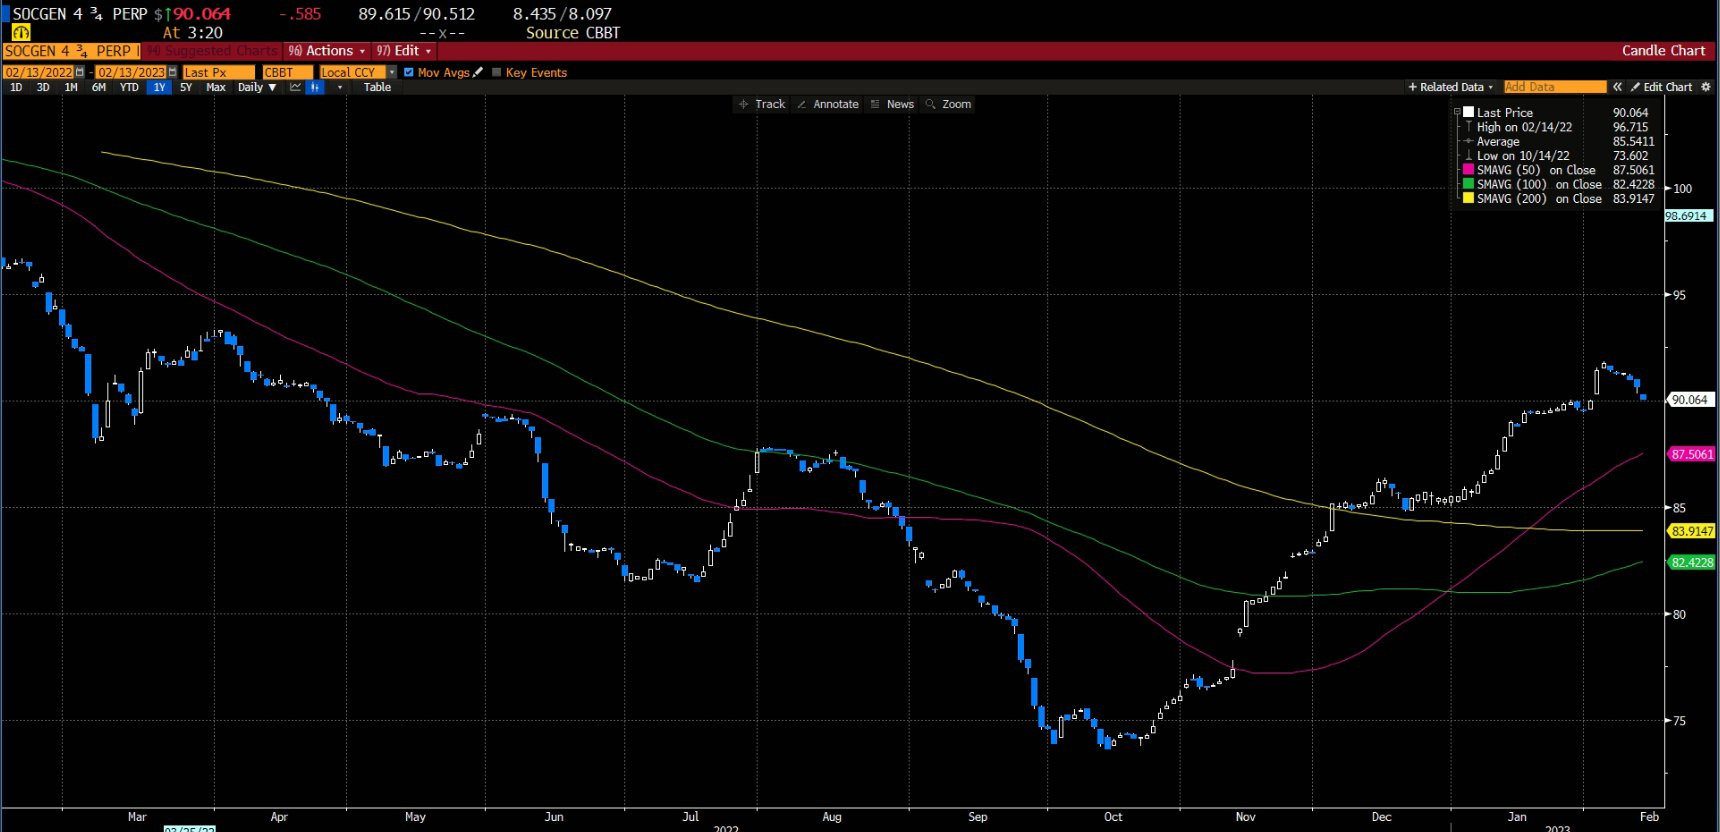
SOCGEN 4.75% perp - It started moving but still inline with what FPE is doing (Benchmark ETF). If I get a reasonable bid today I will short. My preferred way to trade this into CPI will be an outright short as the chart screams to me what a great short this is. I would use to Feb’23 highs to consider buying back the position but it wouldn’t be an immediate action, rather I would wait for a few daily closes above the highs.
CURRENT PORTFOLIO
I have added 5 new positions since last week.
$VIX Mar’23 futures. As of this writing the $VIX Mar’23 contract trades at $22.05.
As the preferred stock ETFs underperformed this week, I did not get the chance to add another 50% exposure to my short hedges in PGX and PFF. I noticed the VIX was bid even when SPX was rallying so I figured it is time to buy it. I wanted to add more short exposure and was looking for ways to do so.
To see the full list of portfolio positions, what the current performance of the portfolio is and what the rest of the potential trades are, please consider upgrading your subscription and supporting our work. By upgrading you will help us grow the research team.
We are keeping the current price of EUR29.99 until the end of Feb’23. All paid subscribers until the end of Feb’23 will be grandfathered at the current rate. Beginning of Mar’23 the price for all new subscribers will be EUR59.99.
Hurry up and lock in the current price.
CONCLUSION:
I am still looking to short the most expensive fixed-income instruments on the street and go into the CPI data short, however I am going to reduce my VIX holdings by 1/3 or 1/2 as I don’t want to give away all of the profits so far , should I get this positioning wrong and the market rallies. This is very real possibility and I am not ignoring it at all. I like the risk to reward on the short side, especially in the very expensive instruments as I strongly believe the upside is limited. A limited upside does not mean there will be NO LOSSES if wrong, it means losses will be smaller than potential wins, if I get things right. Nothing more than that.
Most news you read out there is too generic, written by someone who has never invested or managed money or is just plain bad. GRIT Capital was founded by former $100MM portfolio manager Genevieve Roch-Decter who is on a mission to democratize access to stock market insights to the masses! Subscribe for free!
WEEKLY EQUITY REVIEW:
Note: Friends, I am on a vacation at a place where palms are abundant but good internet is scarce. Therefore, I will keep it to the basics and will be back in full force soon.
Well, we finally got a down week. It might not have been the most spectacular but with so much people on the sidelines waiting to get in on the long side, some back and forth price action was almost guaranteed. SPX is down c. 1.1%, which is close to nothing after a sizeable rally. What is important here is that for the first time since the beginning of NY we got some supply formed at these levels.
Much more interesting things happen at the two other angles of my favorite equities - bonds - dollar triangle. What equity trades must pay attention to is the slow but steady creep up in the dollar. Ever since the monster job numbers that we got and the subsequent effects on the ED futures and rates curves, the dollar has been showing good strength. We were calling here for a DXY long as people were hating it despite a huge pullback from the top without a meaningful bounce. Don’t have a real opinion on the fundamentals here, my thesis was entirely based on positioning, which appeared extreme on the short dollar trade. At this levels I am clueless of its direction, so I am looking closely at price action to feel what it is telling us. And so far, it does not look like the bounce has finished, meaning financial conditions are yet to tighten further.
Even more interesting are the developments in bonds, where treasuries are being hit hard. Quite the sizeable move in rates all across the curve. New highs for the US01Y, but the back end is not less impressive. However you may put it, a move of the whole curve to the upward cannot be good for equities (check discounted cash flow modelling if in doubt), given that current expectations for future growth remain subdued.
And to finish off with why you should be worried if you are long equities, the ED futures just kept bleeding. EDZ2023 showing no cuts and is now at the low of 2022, waiting to break it.
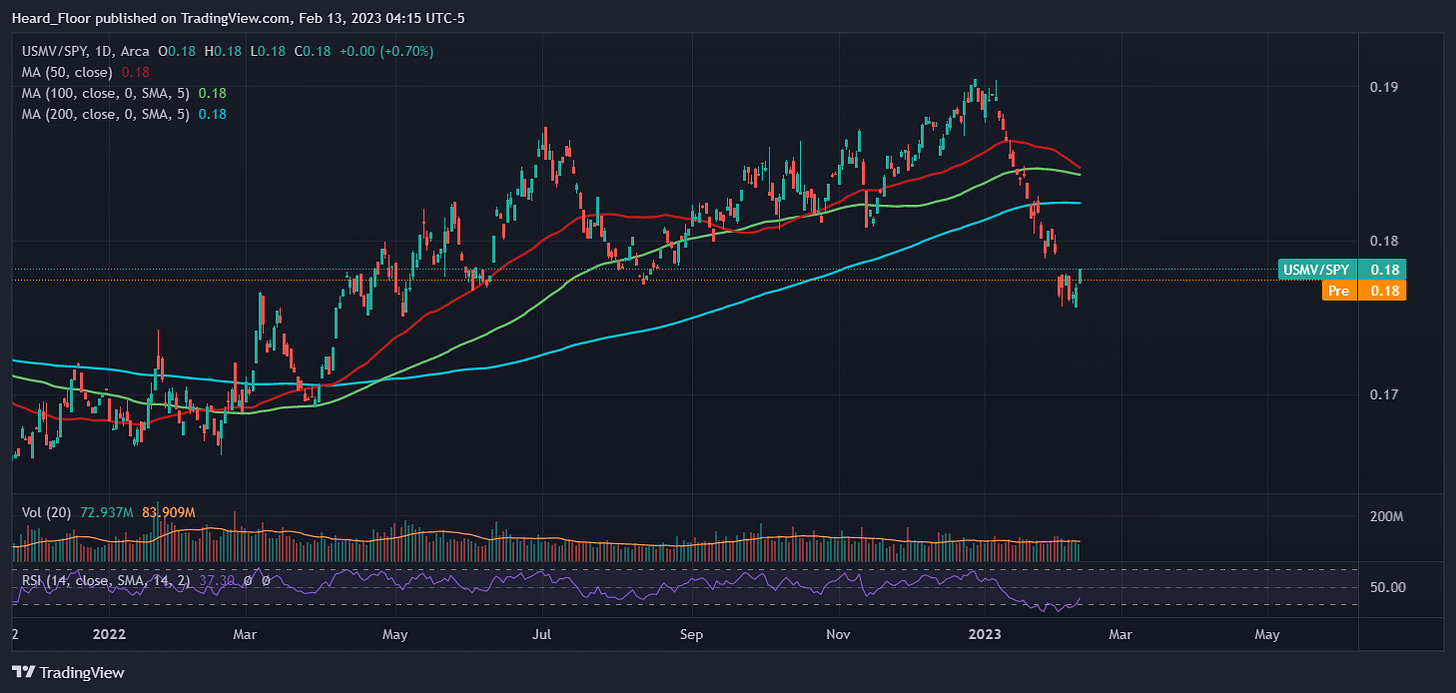
Open positions: I am long USMV and short SPY
Last week I wrote about a pair trade that is long a variety of low volatility (stable, let’s say) equities through an ETF called USMV and short the broad market SPY. You can check out the rationale here:
I am more than happy to say that the market did give me a good entry late into the week and so I got the trade on. As luck would have it, it is nicely up from my entry but my feeling is that there is much more potential here given the dark clouds above equities right now.
Conclusion: Financial conditions have tightened last week and there is little sign of them taking a pause as of now. DXY is grinding higher and the yield curve moved upwards. Equities, however, once again appear slow to digest the potential damage but SPY has finally met decent supply at these levels. This week is so full of data (CPI, jobless claims, etc) that everything could happen so mind your risk folks as volatility is about to pick up.





Could you explain what supply formed means? Thanks!