The Subtle Art of Trade Management
And an opportunity I recently came across
Everyone involved in investing or trading does research. In fact, this is a big part of what we all do during the day. On our trading floor we read Bloomberg, bank research, paid research, private newsletters and speak to traders constantly. Some of us on the trading floor like the bank research and what Bloomberg has to offer, others focus on the paid research. My favorite way to prepare for the day and week ahead is by reading newsletters, speaking to traders and skimming through bank research. I also love the new approach by
and @themarketear (Twitter) where they summarize notable market happenings in a single chart with a brief comment. In today’s overly spammy world, summarizing important market events into a single chart is exactly what traders need. Of course, that does not directly translate into a trade, but to me personally, means that I can quickly determine if something is worth my attention or not.Before moving onto the interesting part I want to give ’s newsletter a shout out. He is the very best in summarizing central bank’s activities and the most important macro events in the coming week. There is so much going on in the central banking world at any given moment that getting up to date without his publication will be impossible. Highly recommended.
Yesterday I was in this exact situation where I was scrolling through
‘s charts and came across a chart showing the yield differential between the Fed Fund Rates and US IG Index’s yield. It was basically zero. A few thoughts immediately passed through my head:How is this possible? You can get the same yield investing in a virtually risk free asset compared to getting the same yield for corporate bonds , with more risk and lower rating. Either the credit market is getting bonkers or something is not quite right.
So I did what every self-respecting trader would do, I shrugged it off and forgot about it. You know, so much information passes through our brains on a daily basis that unless something is of utmost urgence or life threating, I wouldn’t really pay attention to it. But as the day went on , thoughts kept popping in my head:
What if this is tradable? What if I can make this a positive carry trade and get those 4.5% (now 4.75%) while waiting for the trade to work out. Getting paid ~4.75% while waiting for a trade to work really is a good way to position yourself while the trade works out.
The profit potential is outstanding.
The FED has already communicated pausing, there is a hint we may have seen the top in rates.
Then I kept thinking:
What is my risk in this trade?
What would be the instrument to buy which reflects FFR the best.
How can I short US IG Index without paying dividends or carry?
What is my potential profit?
What is my opportunity cost?
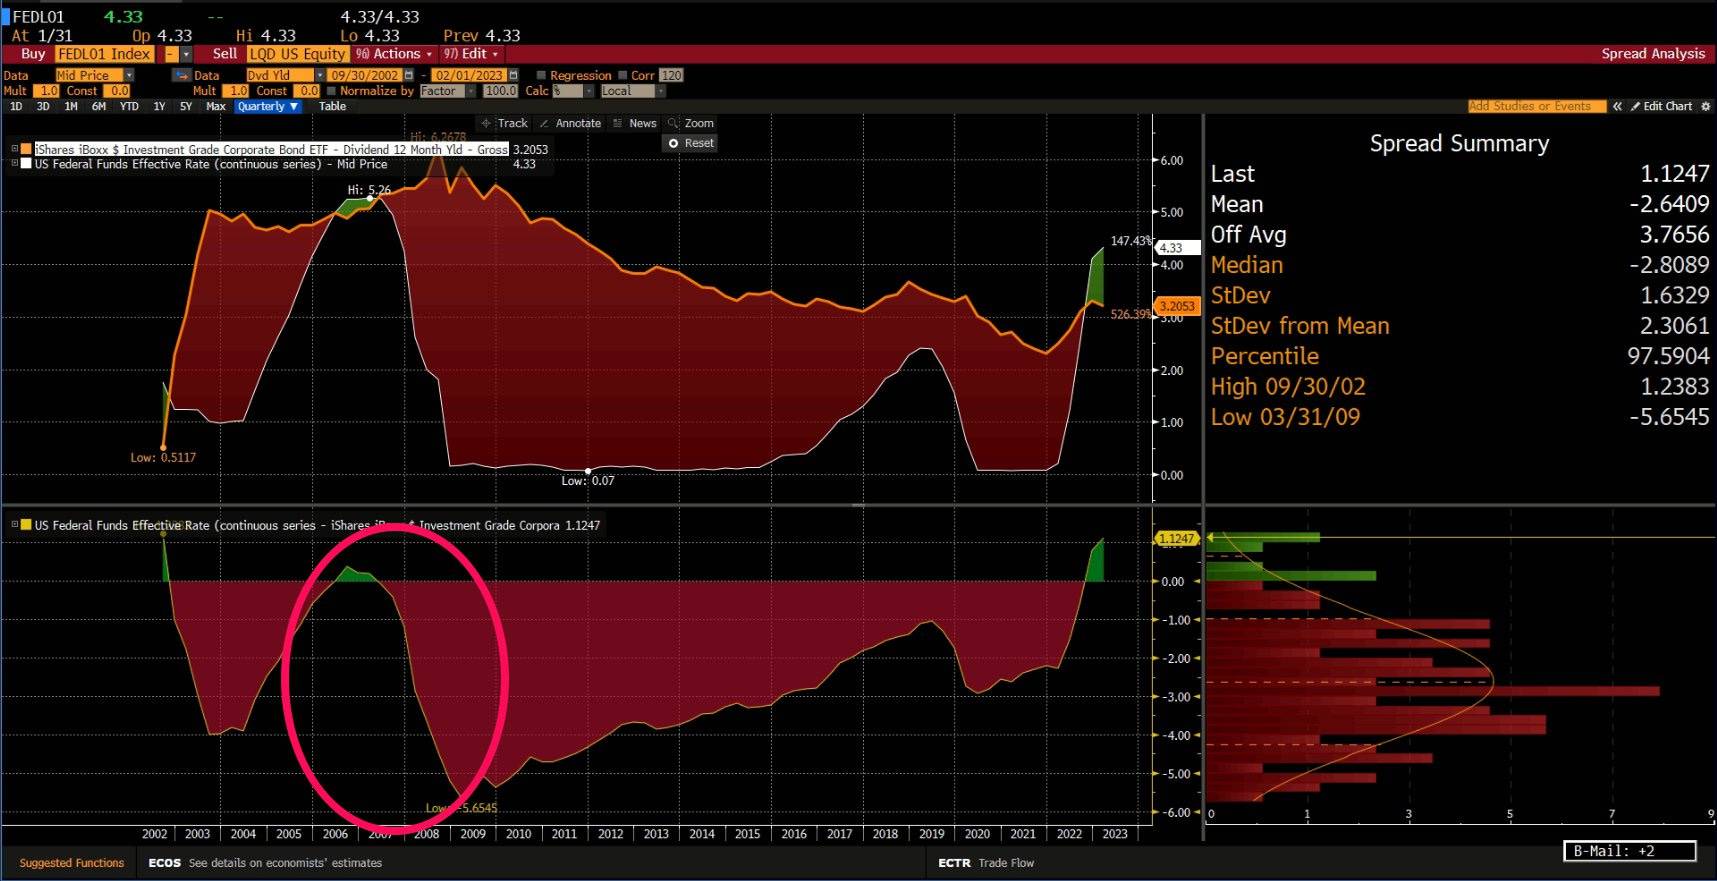
This time I decided to put more effort into the research and finally logged in the Bloomberg terminal. I decided to plot the current FFR against LQD’s (IG Investment Grade Bonds ETF) dividend yield.
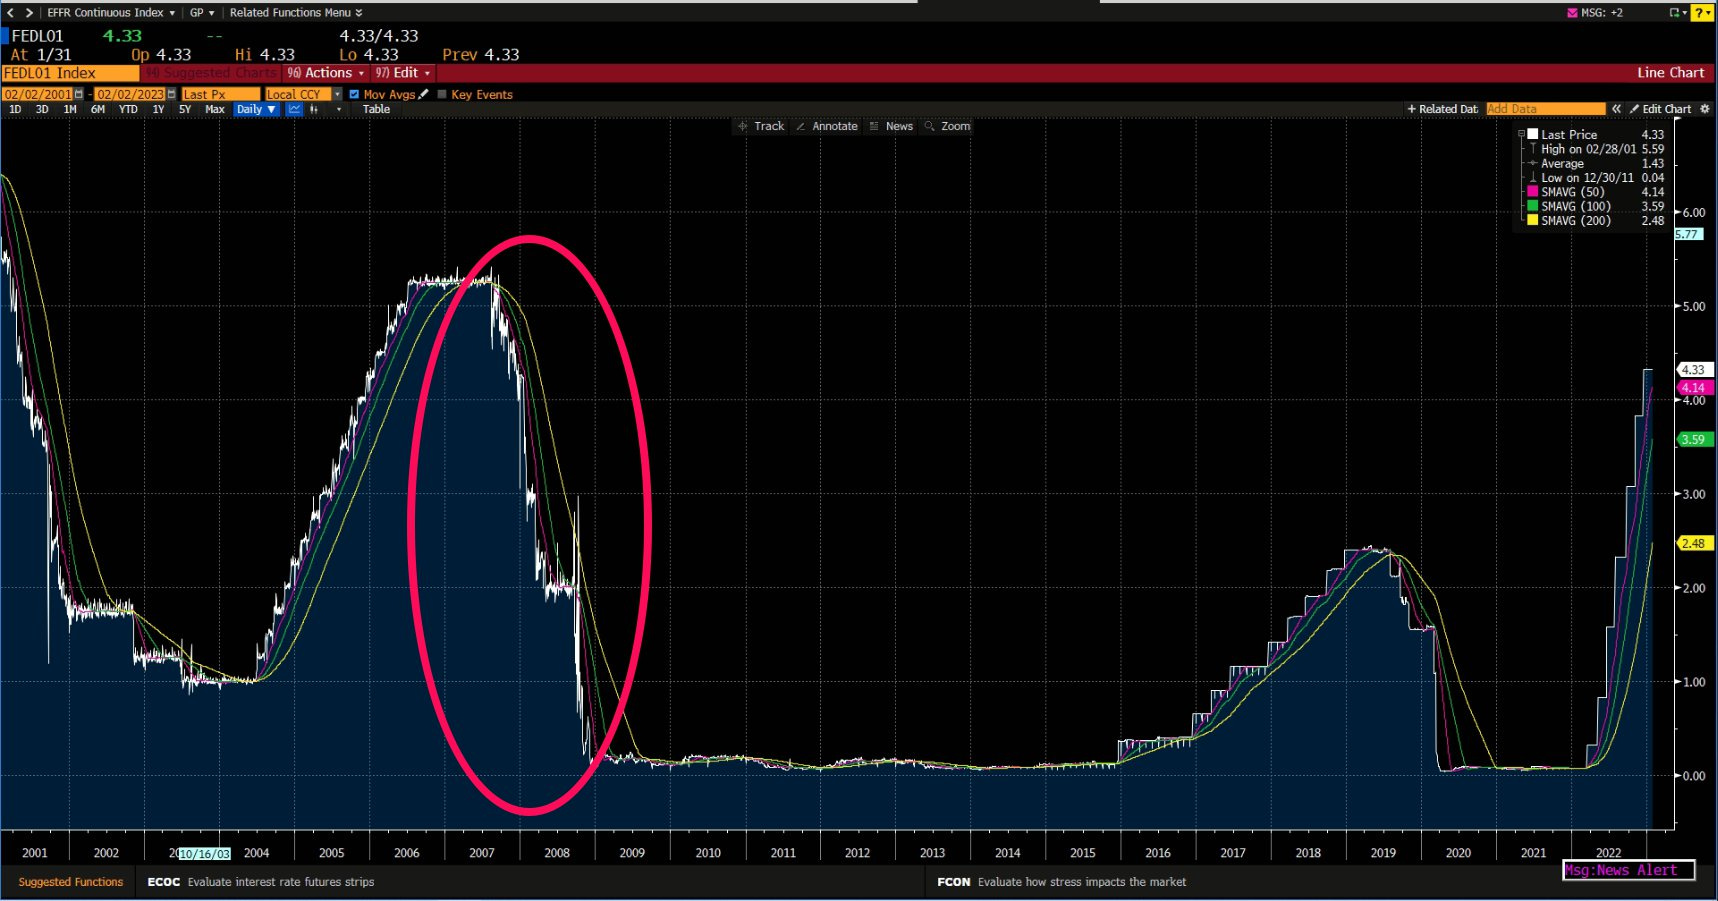
FFR - As of today Bloomberg shows 4.33% but it should change to 4.50% (Lower band) - 4.75% (Upper band)
LQD dividend yield - 3.22%
Spread between FFR and LQD dividend yield - 1.30ish% - One of the highest ever.
This begs the question - What is the trade really about and what would make it move in my direction.
The current positive spread comes from the higher Fed Fund Rates coupled with the fact that a lot of the LQD holdings are low coupon payers that the index added in 2020 and 2021. The turnover had not been high enough to replace the lower coupons yet to make a meaningful reflection in the dividend yield. That is why LQD is making a comeback in price, not yield. Simply the lower yielders have higher convexity and when we currently experienced drop in yields, they were the ones to jump in price (percentage wise) the most.
The second thing I wanted to look at is what made the trade profitable in the past. Looking back at the charts, it was evident that the cut in rates is what gave it a boost but in the 2007-2008 case, the GFC helped make the trade a monster winner. But this begs the question. Is it not better to just buy short-term yields and wait for Powell to cut rates, if this is what really makes the trade profitable?
WHAT YOU COULD SELL:
There are cases for going long a short-term instrument and going short LQD
1. If you believe we reached the peak in FFR, then you have a strong case to just go long.
If you are a believer that the inflation peak was not yet reached then a short in LQD would offset the trade. Just the thought of higher terminal rate should bury LQD.
As I am personally a fan of not leaving much to chance, I would go for the short with LQD. Now you may counter me and say that the borrow fees and dividends that you have to pay will kill the trade and I would absolutely agree. That is why I would be forever grateful to the CBOE for inventing the IBIG futures (a replica of LQD). As you know, in futures you don’t pay the dividends and the borrow fees. Presumably they are in the price. And you would be right, but just for the dividend, not the borrow. So this saves you a bunch. And sometimes you may be lucky and short the futures contract at a prices that is partially inclusive of the dividends further cutting your costs. The point is, futures are better for shorting as not the full price of the dividend is always included and you avoid paying borrow fees. In some cases you will save 1%, in others 2% per year but most importantly of all, you are protected against jump in borrow fees. Either way this will improve your carry. When you hold a position for 3 or 6 month period, you would want to improve your carry.
What you need to consider though is your roll costs as the short position would be in the quarterly expiration futures contracts. As of this writing I cannot calculate them but there will be some, usually equal to the spreads paid to get in and out of the contracts as well as the commissions.
Lets move onto the long position.
WHAT YOU COULD BUY:
3 or 6 month treasuries.
Treasury bond maturity end of 2024. (Basically a 2 year treasury bond)
2 year bond futures.
1. Short-term treasuries would require constant rolling which will incur rolling costs (buying a new treasury every 1 or 3 months) but you may benefit from higher for longer if the FED sticks to it. Also your carry will be better compared to a 2 year treasury. In 6 month t-bills you currently get 4.80%ish while in 2 year treasuries you get 4.10%. 70bps difference. Up to you to figure out if a few rolls would cost you 70bps. Whether it makes sense to do it or not would be up to the rolling costs which I don’t know how much would they be.
2 year treasuries - you will not have to roll every other month therefore less slippage and commission costs but you will get slightly lower carry , around .40bps lower. Additionally, if higher for longer gains ground, you will have a an adverse move in the position, whereas with a 3 month treasuries you would benefit from such a move as on the next roll you will buy the new 3 month treasuries that yield more. Higher for longer benefits the short maturities.
2 year bond futures are not my preferred choice because you are not entitled to the coupon as you are not buying physical treasuries therefore there will be no positive carry in the position. Since the trade’s premise is to take advantage of the carry, this option would be void.
I would go for the 6 month treasuries for the following reasons:
I believe we will get higher for longer eventually and with just 1 roll, I would be able to get around 70bps more in yield for 1 year.
I am opening up myself for switching to 2 year treasuries IF we get higher yields in the next few months. Therefore I am allowing myself more optionality.
However, if we get lower rates right away, my positioning will be off and the position will suffer.
And onto the final question:
What should be the ratio of the long position against the short position. As we are trading yield differentials , we would need to duration adjust the two positions.
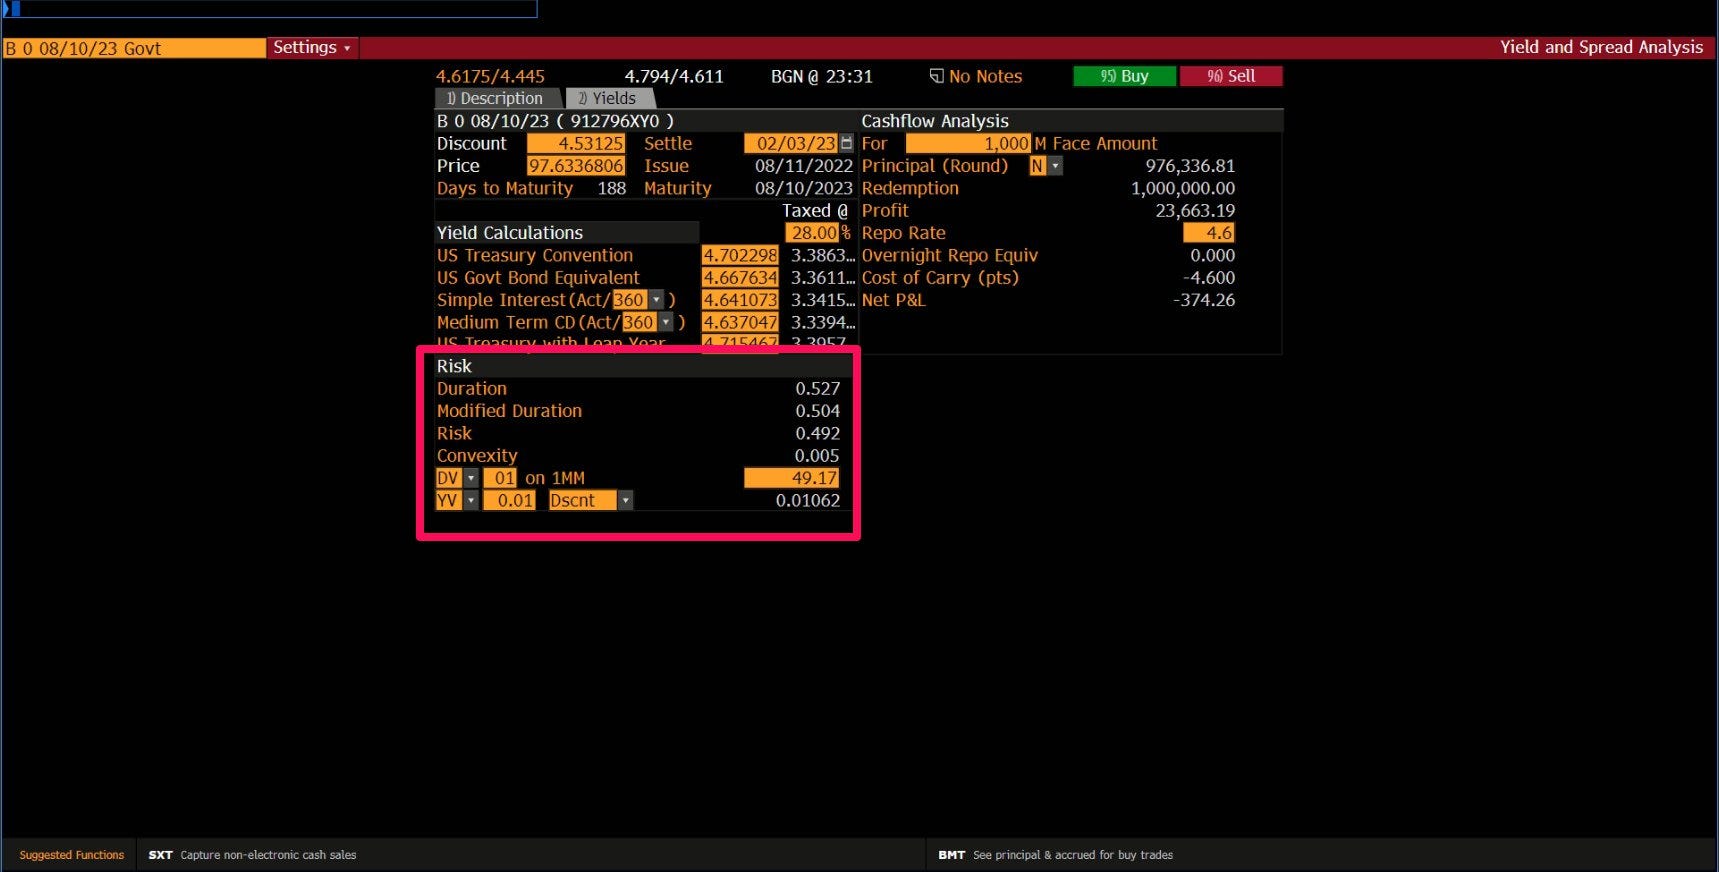
6 Month T-bills - 0.504
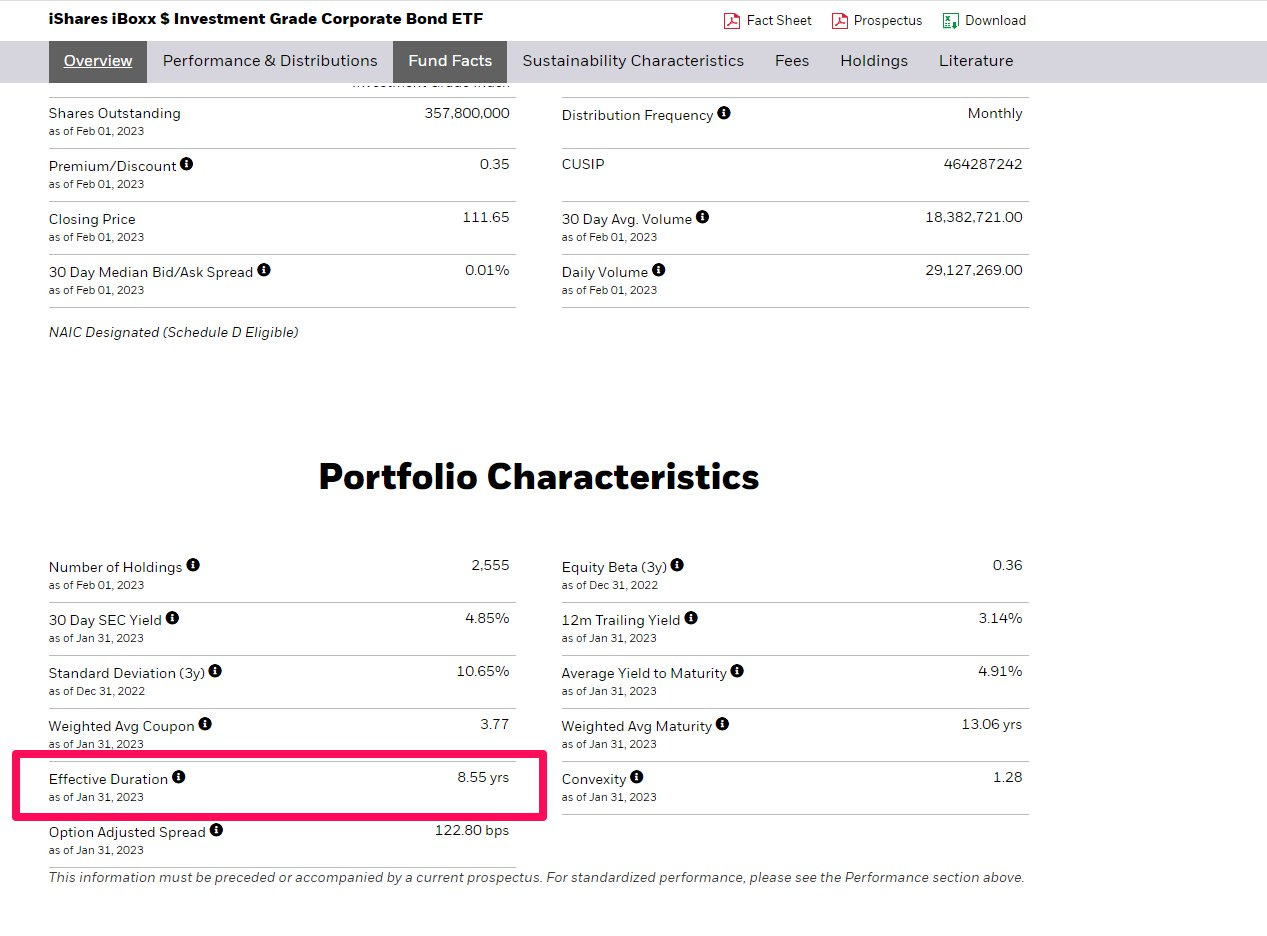
LQD - 8.55 years
So what we have to do is get the duration of the long instrument and divide by the duration of the short interest. The number that comes out tells you the ratio of your long vs short position. The 6 month T-bill modified duration is 0.504 while LQD’s modified duration is 8.55. Therefore we divide the t-bill’s duration by 8.55 and get 0.059 ratio. Said in plain English, I would need to sell short LQD futures with a 0.059 ratio. For every $1 000 000 of notional exposure in T-bills, I must short $59 000 notional exposure in LQD futures. Tricky part is that duration changes on a daily basis. Not by much , but it changes. Therefore occasionally (maybe once every 2-3 weeks) you would need to adjust the duration ratio of the pair trade.
STOP LOSS
Finally, we need to consider where our stop will be. My approach is always the same regardless of the position or asset class I trade. I have a fixed dollar amount that I am willing to lose per trade and do not compromise with it. The second part of the equation is to figure out where on the chart my idea will be invalidated. I calculate the distance in percentage terms, from the current price and calculate how much size I would need to deploy so that If my stop is hit, I would not exceed the fixed dollar loss that I set myself prior to entering the trade.
I cannot emphasize how important it is to have a set stop loss in dollar amount for each trade. This practice brings a lot of stability to your PnL and gives you the confidence that you can control your equity curve. It goes without saying that you can increase or decrease the fixed dollar stop as your equity curve goes up or down but the underlying concept should not be compromised with. Do not vary your dollar stop for each trade you take.
CONCLUSION:
This morning, while I was having my cup of coffee I thought hard about whether this trade is a 6M-10Y curve steepener. I was thinking, why the hell did I waste my time to go through this idea when you could as easily do a steepener. Guess what, it turns out it is, but not in its entirety. The curve steepener assumes no credit risk whereas the short against against LQD assumes such risk. On top of it, you get the benefit from the higher convexity of LQD should we get a sell off and believe me, eventually we will get it. By going short LQD you position yourself to take advantage of widening credit spreads and higher convexity working in your favor boosting your potential returns.
Thank you for going this far. If you enjoyed this publication we would be very happy if you comment, like or share to help us grow.
If interested, you can gain real time access to us via our private Twitter account if you upgrade. You will also gain access to our portfolio and new portfolio additions and deletions.


Thanks for the idea. With regards to the beginning of this post (research), I have access to Creditsights via my organization. Are there any other research websites like Creditsights that you would recommend?
Excellent commentary walking me through the thought process, read that twice and not yet the last time.