CREDIT MARKETS.
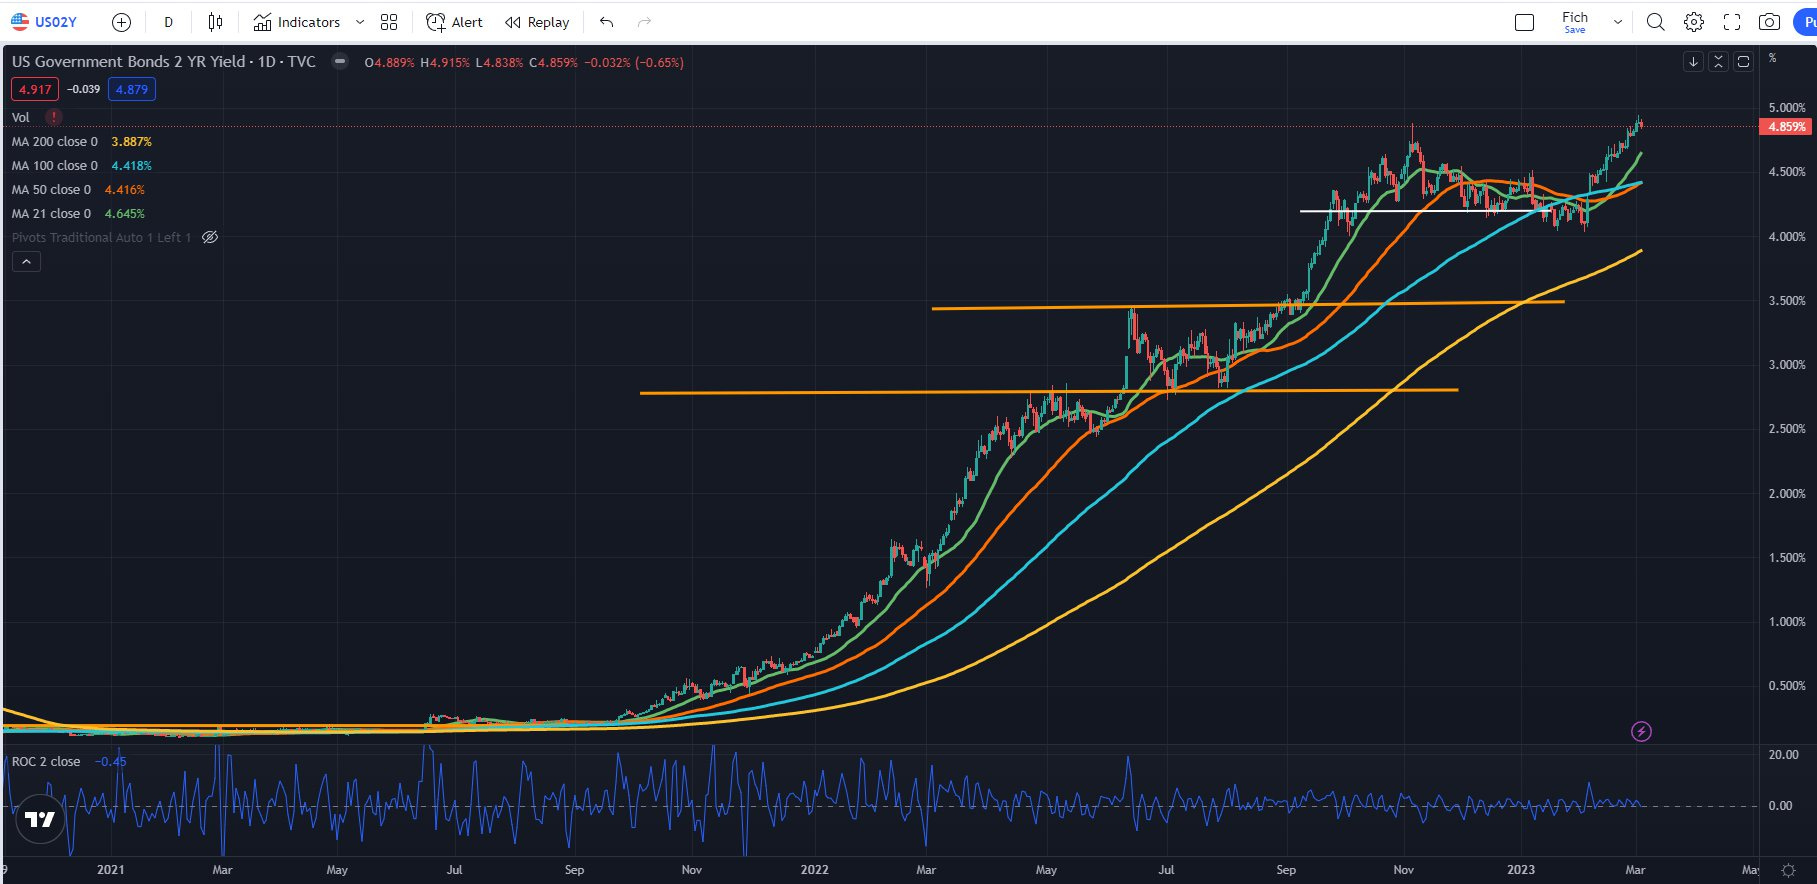
We saw the US 2s10s invert the most since the early 1980s, we saw the 2 year hit the highest level since 2007 and the terminal rate not retracing from its highs.
Europe didn’t want to stay far behind and also hit the 2s10s most inverted level since the 1990s. To be brutally honest with you, I expect further inversion as the short-end likely stays at current levels for some time while the long end bounces from the current levels. More inversion before the steepener trade takes over Twitter.
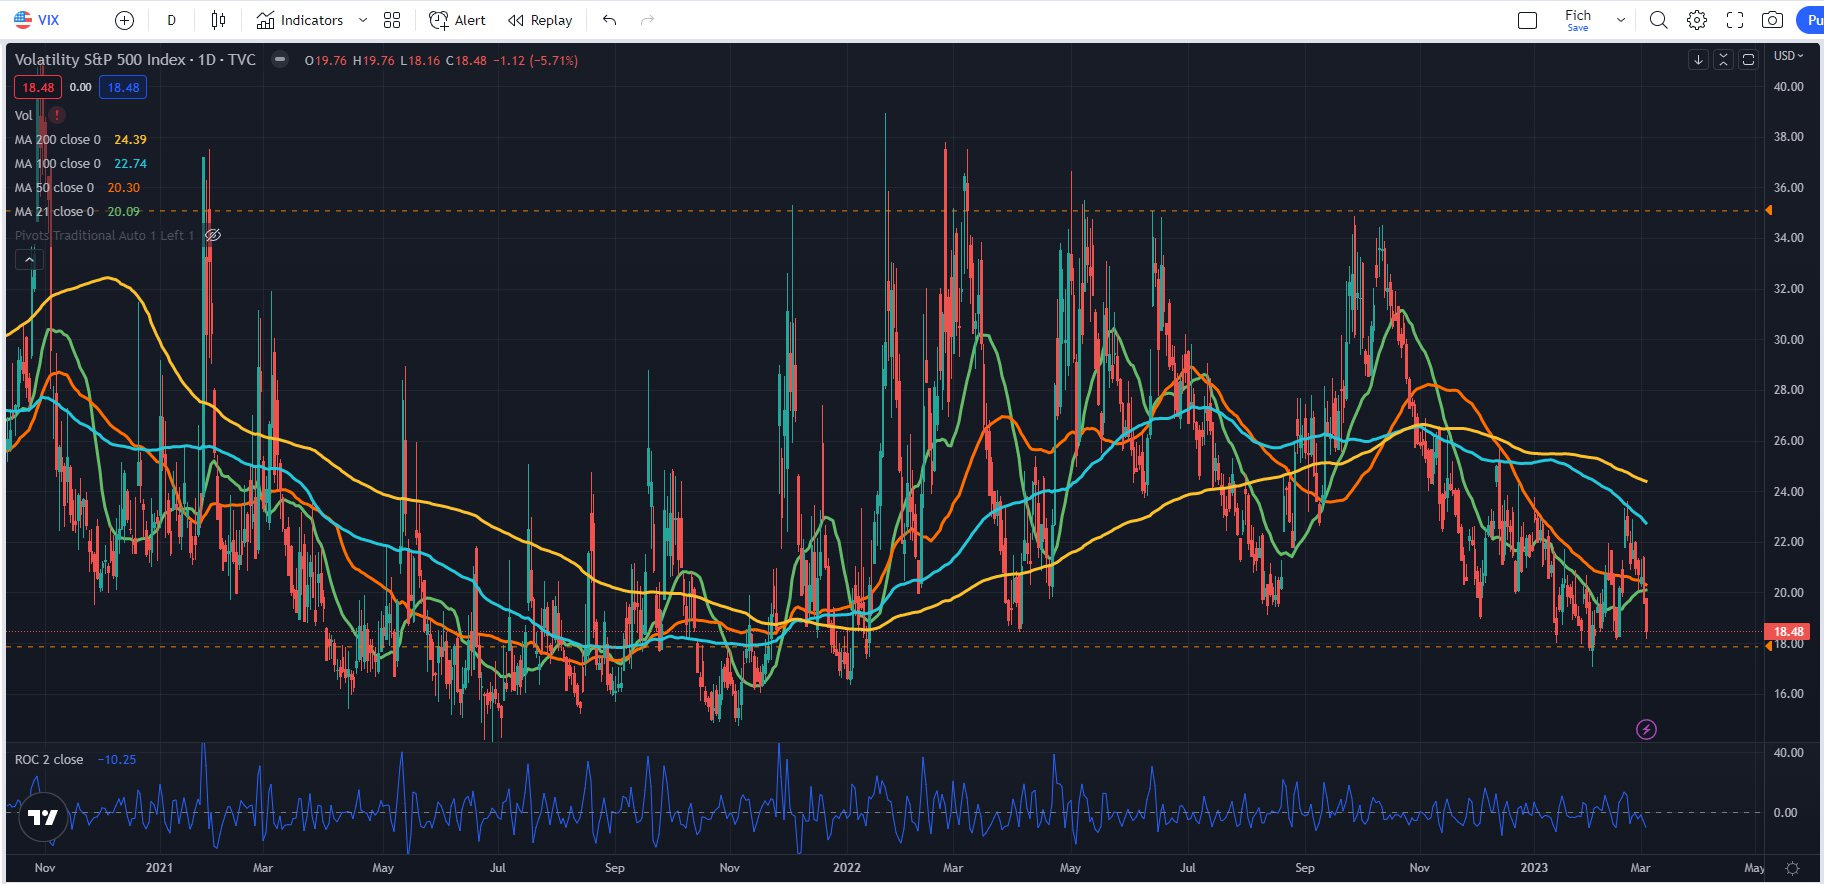
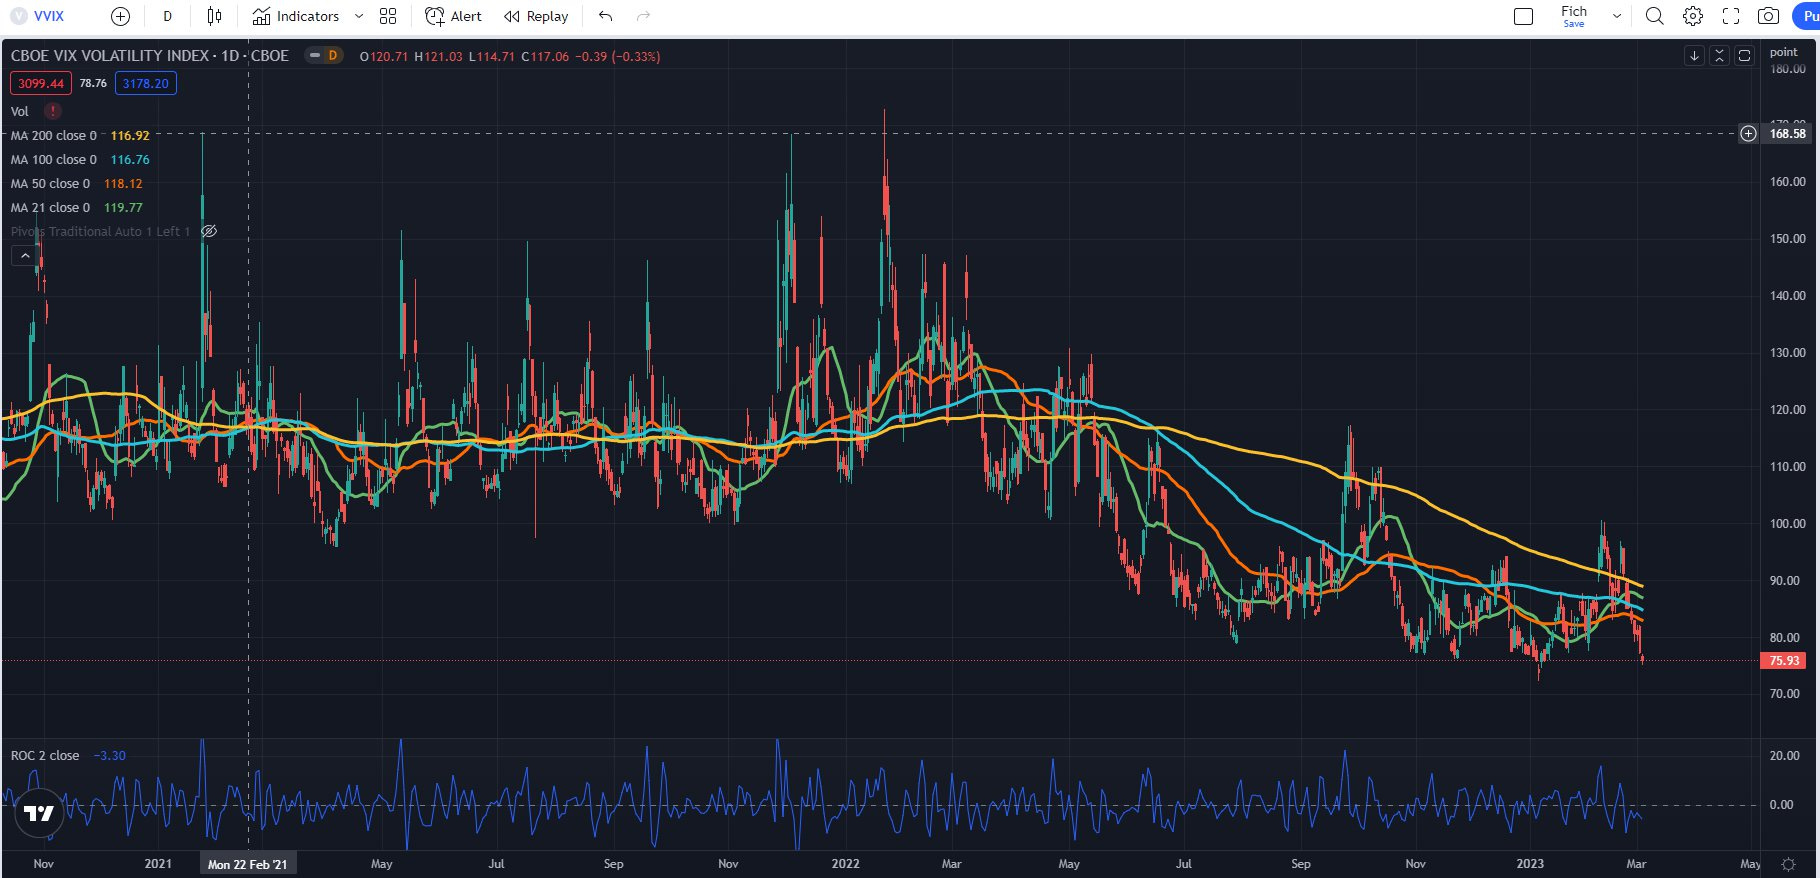
And what did all this equate to? Volatility compression. Yeah, you read that right. I am sure you want to put a comment below and ask me why the heck is that happening, it doesn’t make any sense. Truth is I have no reasonable arguments except for the fact that I felt we will go this way based on price action. On the price action of my short positions. My VIX position and my shorts were not behaving as expected and I noticed how the VIX underperforms relative to SPX’s daily moves. Both VIX and VVIX digging deeper holes. If there was fear the VIX would have outperformed. The result was lack of follow through.
You can read the whole rant on Twitter.

Another potential argument is the lack of new highs in yields in the long-end which suggests traders are not really expecting the current drama to continue for much longer. Maybe it stays for 1 more year or so but eventually we will get the cuts. This precedes the lack of fear. The confidence that there is now certainly in the markets. And markets love certainty. Great quote from

Given the lack of fear in the bond and equity markets I am still a believer that the path of least resistance is to the upside (in the short-term) and being short is not the wisest thing to do. At least not yet. That is due to the very simple reason - if the bond and equity markets are not fearing all the doom and gloom coming from the expected higher rates that are likely to stay for longer than anticipated then what would happen if we see just one data print pointing to lower inflation? Yes, it will be an epic squeeze. I assure you, you don’t want to be short if that happens. Yet I don’t want to switch to long, at least not in a swing trading fashion. You already think I am going crazy. A few sentences above I am talking about the markets not showing fear and not to be short, and right now I just said I don’t want to be long. Truth is I have no idea what may happen in the next 1-3 weeks. I don’t even have an inclination. Having that in mind I prefer to be positioned in carry trades, hopefully earning a few hundred bps above the risk free. I spend some type going through our scanners to find some of the better opportunities available.
POTENTIAL TRADES:
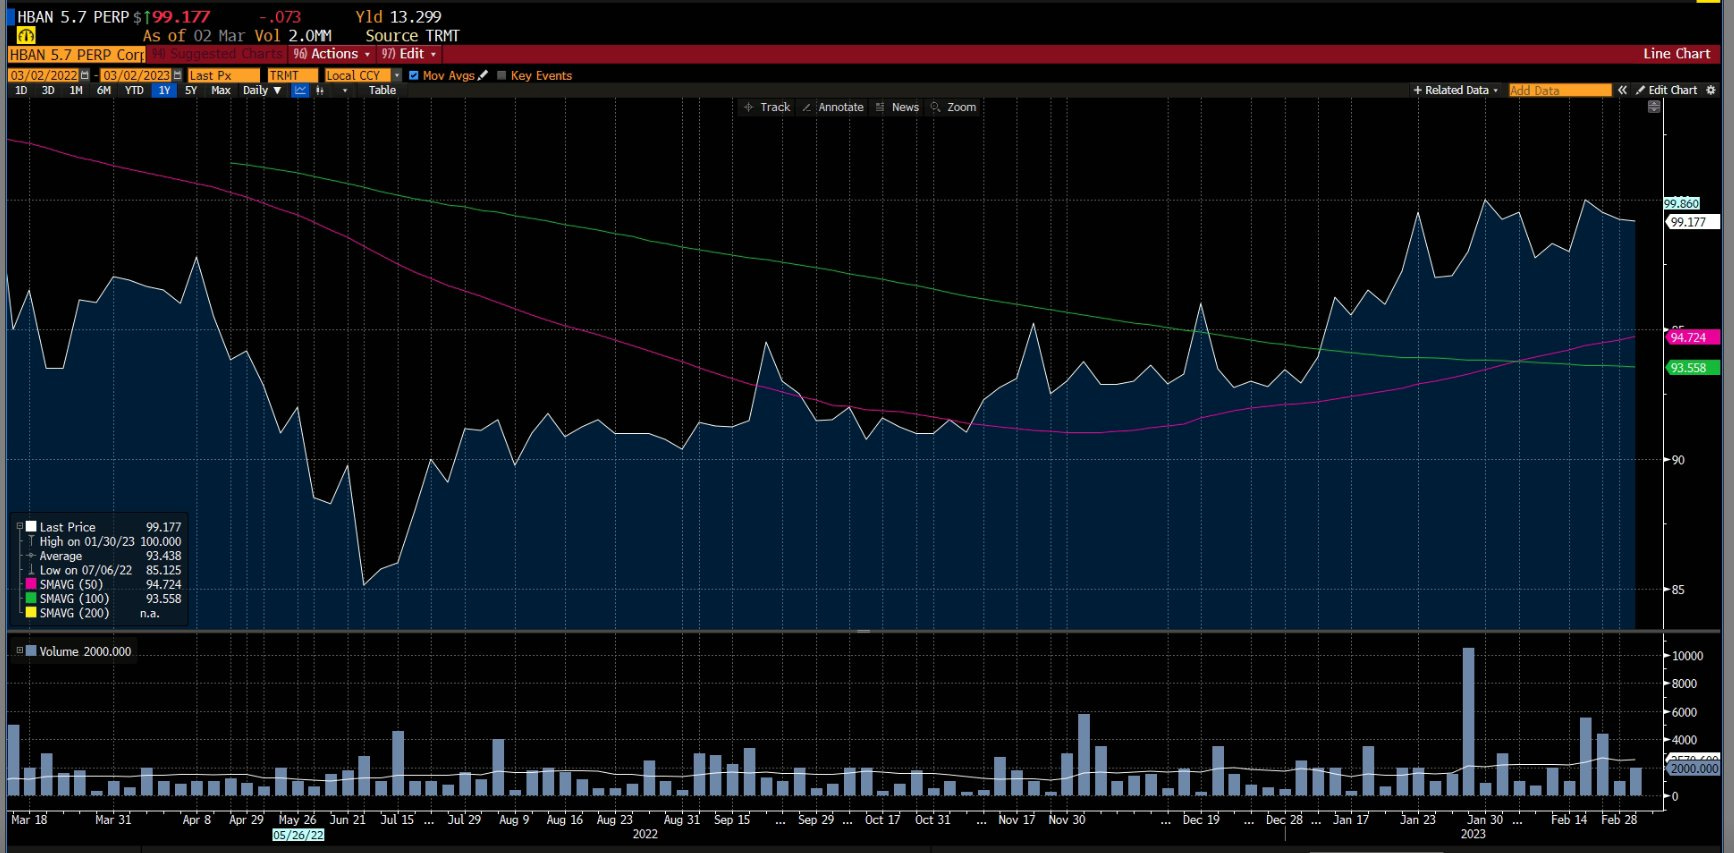
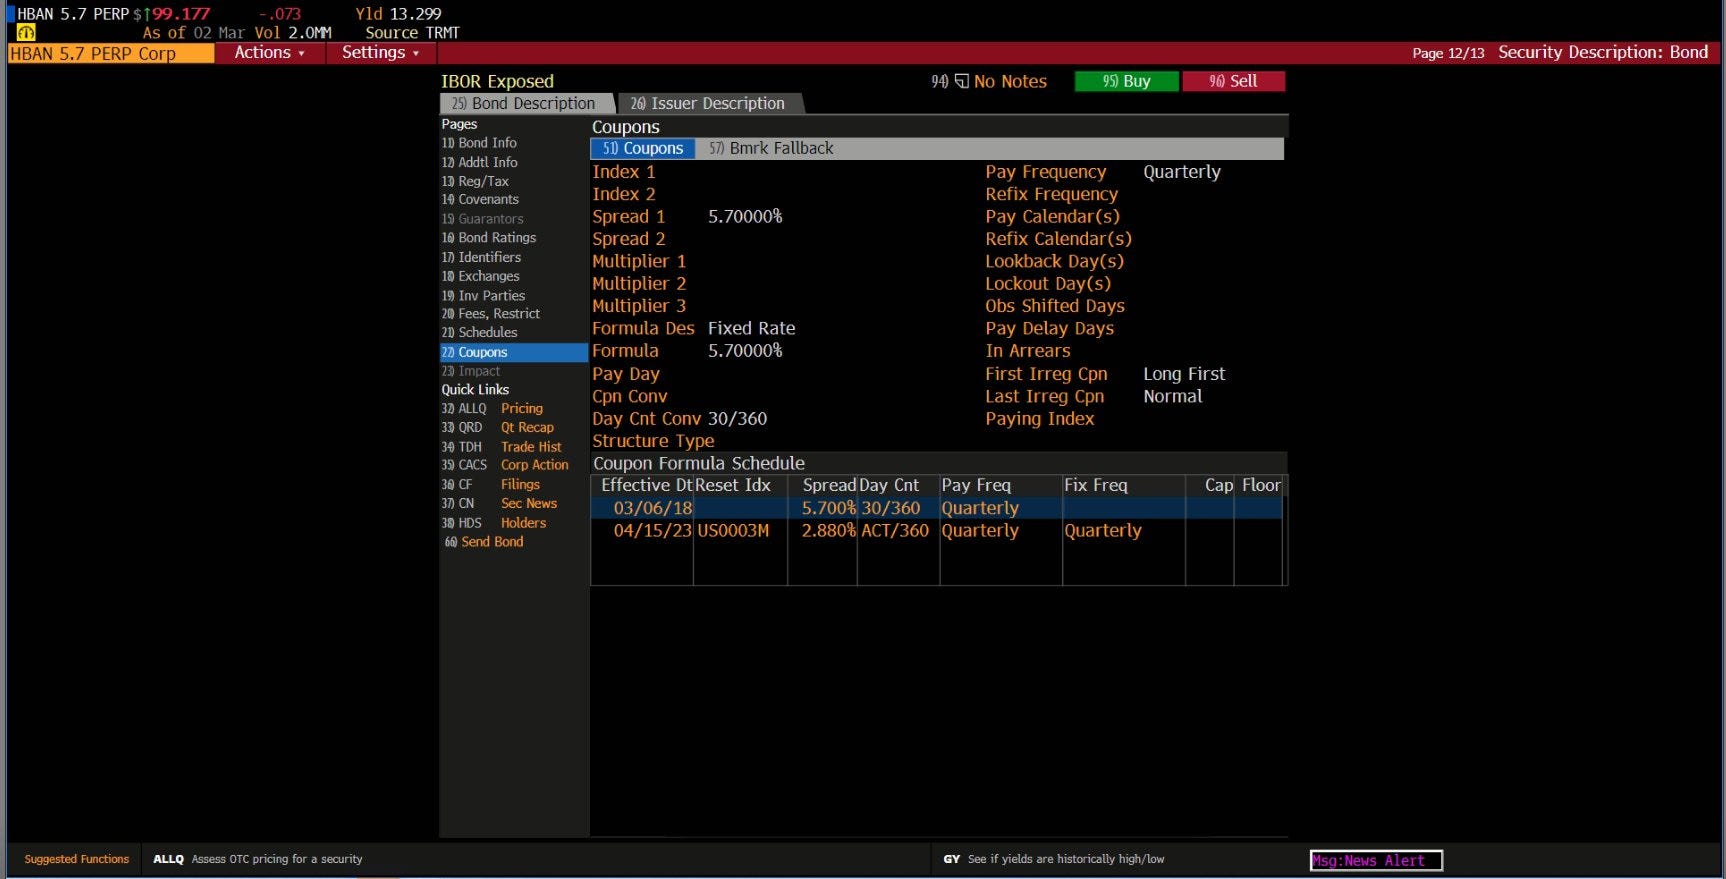
HBAN 5.7% perp - This one starts floating in April. I am pretty sure the 3M Libor will be in close proximity to the current levels of ~4.95%. Adding that to the fixed spread of 2.88% will give us a 7.83% floating coupon reset every quarter. At the same time they just recently issued another perp at 6.875% which makes it well known that they have the ability to refinance cheaper (given current rates, which are high). It becomes apparent that buying it below 99.5 makes sense for both the yield and potential minor capital appreciation.
But why do I like the floaters opportunity so much?
To start with I have no idea if the fixed income markets will rally or drop from here. I don’t find meaningful risk to reward opportunities for directional trades, regardless of the direction. Therefore I want to earn more than the prevailing risk free rate by positioning part of the portfolio in instruments that I deem safe on a relative basis and that yield ~8% - roughly 300bps above risk free. That is my motivation behind this idea.
Now lets move onto some of the pros and cons of the floaters themselves
They (mostly) trade around par until called. Downside is very limited and present only if idiosyncratic risk hits them. (Risk of bankruptcy) However with the IG rated ones that risk is low.
If bought below par there is the potential for capital appreciation. Not much but it is there for the taking.
If spread across multiple instruments this idea can utilize anywhere between 30mm to 50mm
There are a few potential issues:
The instrument may get called right away. Our primary bet is that they won’t get called right away. Current yield is not as attractive before these instruments become floaters therefore there is the possibility I assign capital to mediocre instruments. But even if that happens I will get at least 70bps above risk free and a bit of capital appreciation in the HBAN 5.7%perp. There are others that are slightly better
Benchmark rate may drop and the potential floating rate may be less than currently anticipated. Likely not in the first two quarters of becoming floaters but eventually they will yield less once the 3M Libor (3M SOFR) drops. If course, the opposite can happen and if FFR keeps going higher, the reset rates will be higher too. However these possibilities may become reality only if the floaters don’t get called.
There are plenty others floaters that are also worth looking at. I have wrote an extensive review on the best ones and included our full watchlist for our private subscribers. I think 30mm to 50mm can be easily deployed in that idea alone. You can find a little bit more in the screenshot below or in one of our previous articles.
Now lets check WHAT ARE THE ETFs telling us?
PFF - The $32 level held twice without even trying to break it. It says that it is important and looked at should we go down to test it again. Given the lack of fear in the fixed-income ETFs , I find it a lot more likely to see this level hold. There must be a brand new fear factor in the market for us to see this level broken. It didn’t get broken even when we got to 5.5%-5.75% terminal, therefore something more is required.
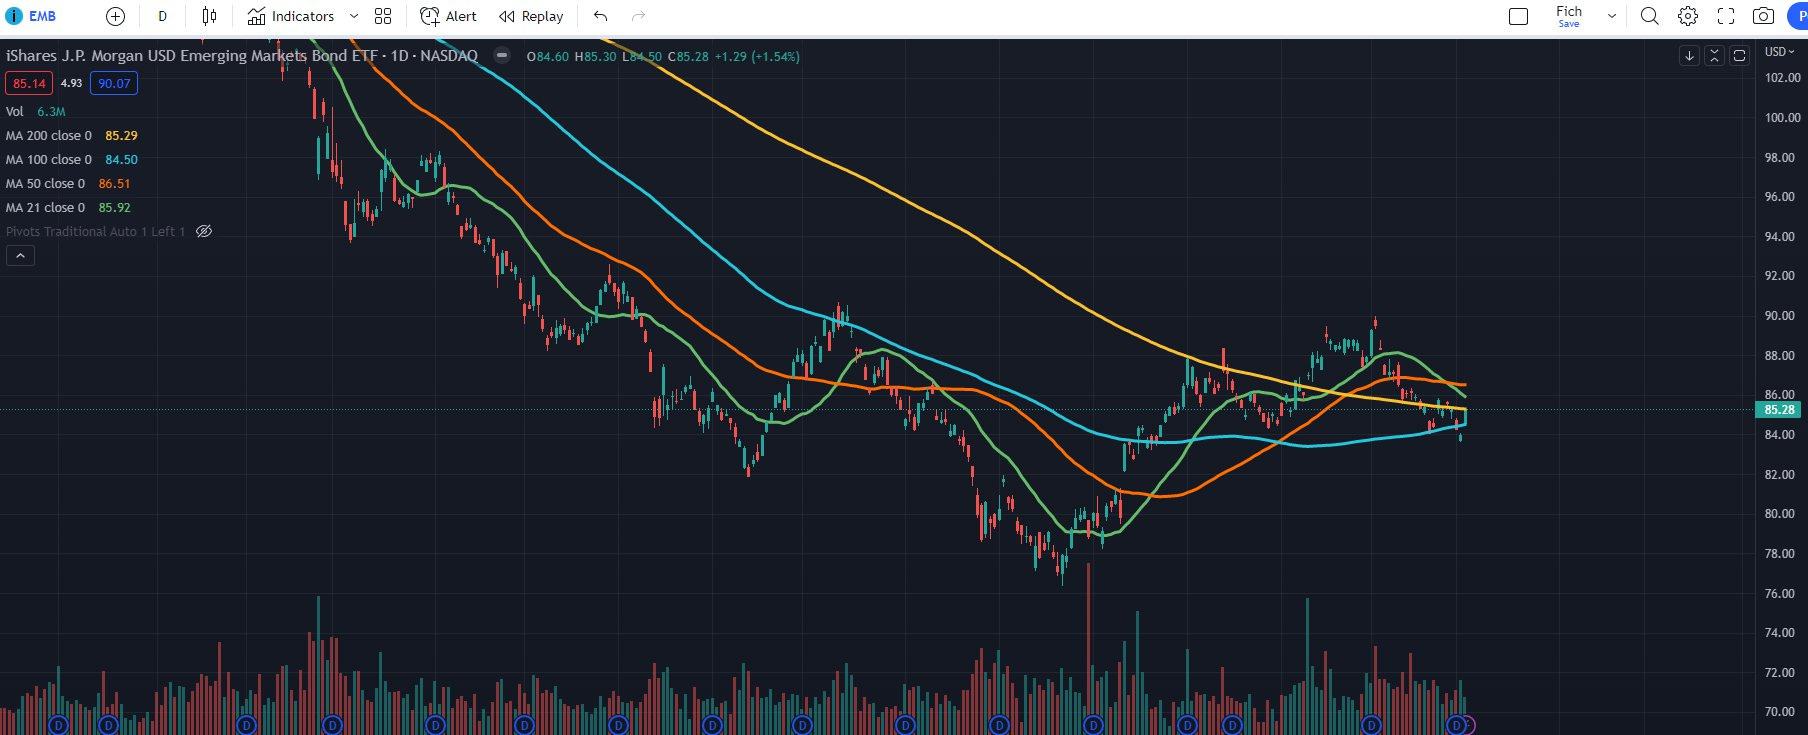
EMB - Nothing as clean in EMB apart from a clear hold of the 100d SMA. Of course without much context it doesn’t mean anything to me therefore I wouldn’t really put much weight into it. If I find a more factors for long , then I would consider it but so far I wouldn’t put risk in such a trade.
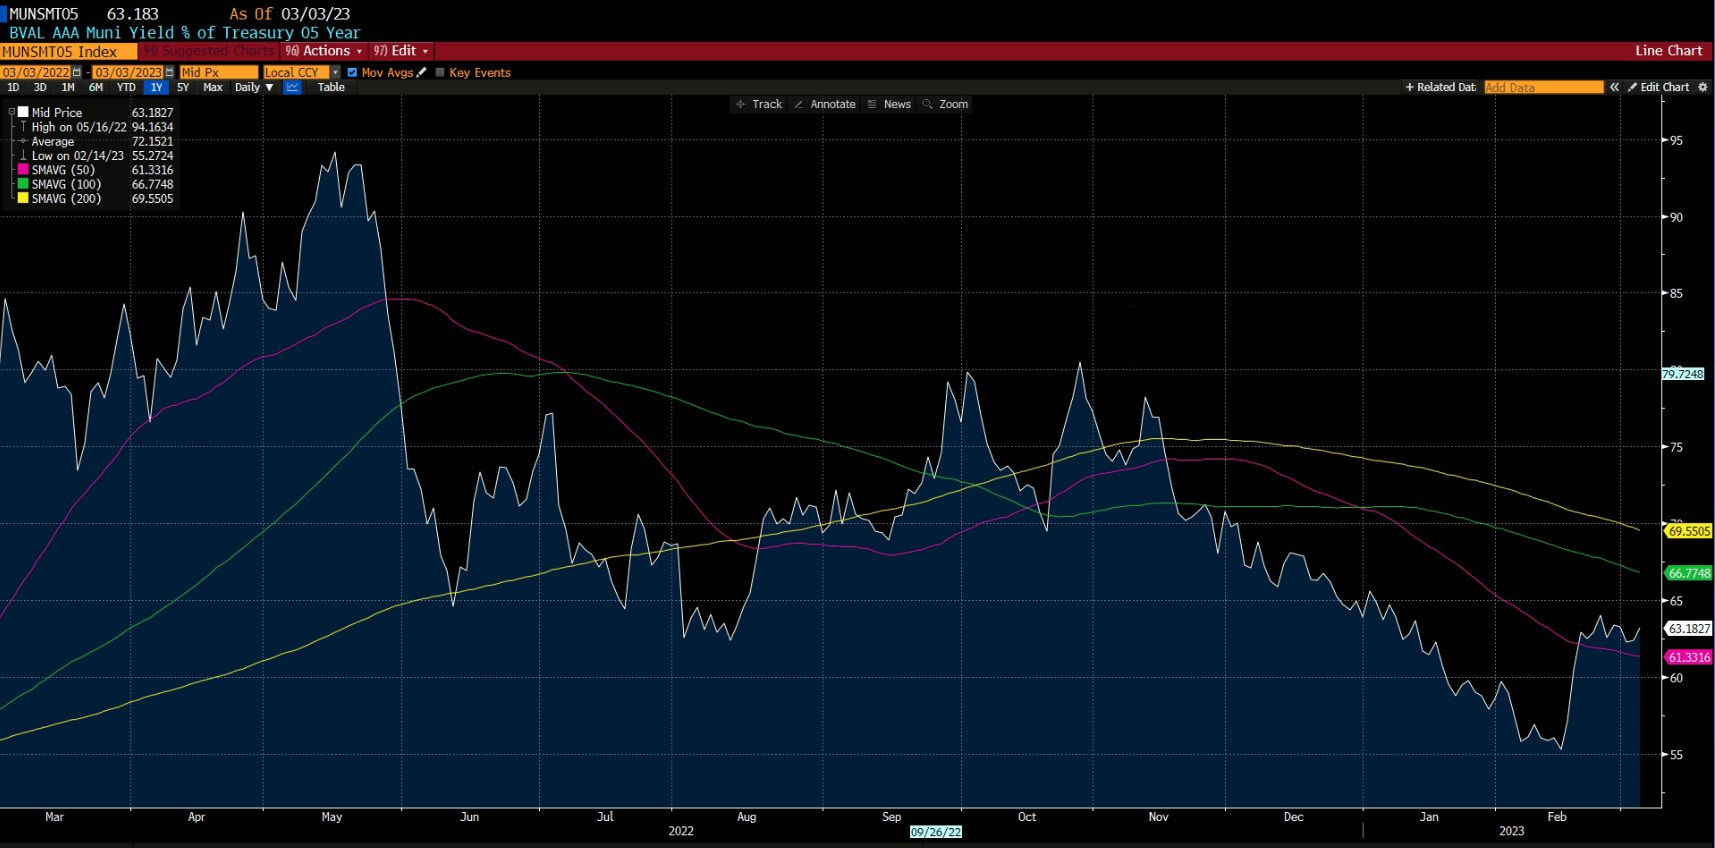
MUB - I like the 100d level here as a reference point for a long position but NOT UNTIL I see the MUNST05 credit spread tighten and rates drop a bit further. There is often divergence between MUB and the MUNST05 index, therefore I am waiting for that exact moment. We are not there yet but maybe it will come should the market keep the current sentiment. I am watching it as an opportunity to go long but currently I do not have a position.
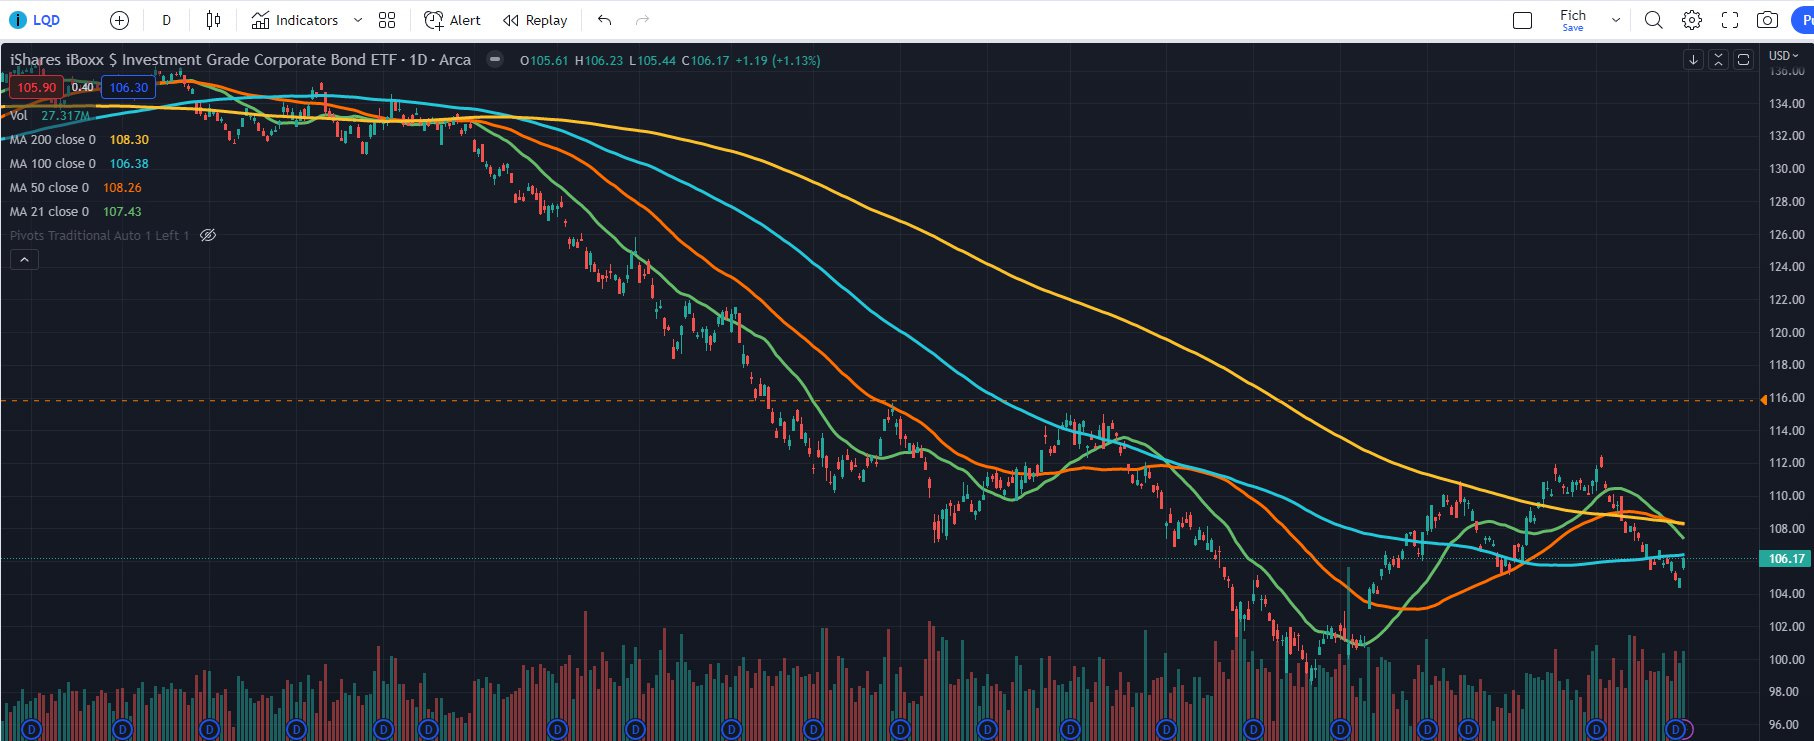
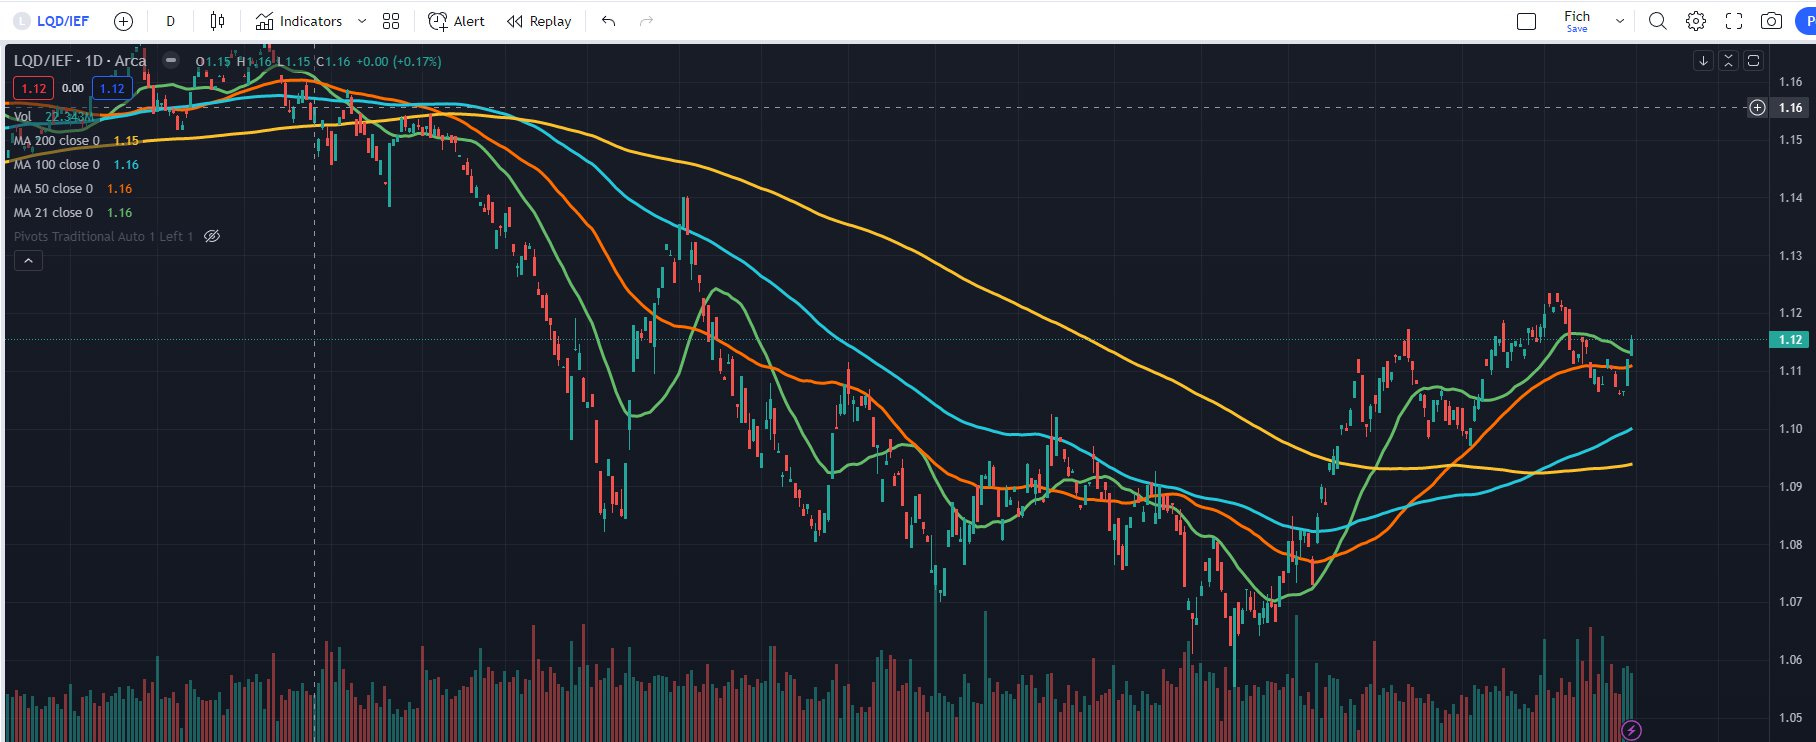
LQD - I don’t think there is anything worth doing in LQD at the time being. This currently is purely a rates play. If you feel confident credit spreads will further tighten you can trade it versus IEF but I personally don’t see the appeal.
CURRENT TRADES:
This time I want to put more light into the performance of our portfolio as it directly reflects the performance of our current trades. This way readers of our work will be better able to figure out how our ideas perform. In late January we started tracking our trading ideas in a portfolio and compare the performance to what we believe are the best benchmark ETFs. We finally had a full month in our portfolio so I can happily share what our progress has been so far. Each month I will post how we are doing on a MoM basis.
For the first one and a half months the portfolio managed to outperform all of its benchmarks. (First trade was on the 11th of January’23. Benchmark performance taken from the date of first trade)
Screenshot below had been taken on the 1st of March after the close. The outperformance is based on the initial 50 million portfolio. Starting the 2nd of March the portfolio was raised to 150 million to show HNWs, Family office managers and PMs that the ideas we share can easily utilize more capital.
The benchmarks’ performance for the same period of time 11th Jan’23 (first trade in the portfolio) to 1st of March’23 are as follows
Risk free return - 0.65%
LQD - (-4.29%) (excluding dividends)
HYG - (-3.07%) (excluding dividends)
PFF - 0.19% (excluding dividends)
PORTFOLIO ROI for the same period - 1.98%. Result is achieved with a maximum drawdown of -0.47% resulting in a 3.58 Sharpe ratio. It is a good start but should be noted that past performance is NEVER an indication of future performance. Bad things can happen to any trader at any time and the portfolio will suffer.
However, it should be noted the frequency of ideas is not high and we post only when we believe the odds are in our favor and the risk to reward ratio is good. One of the reasons to not be active like other services is that I am strong proponent of the mantra that good trades do not come often. Given the current high risk free rates we all are in this favorable situation where sitting on cash pays you handsomely while waiting for the better trades to come to us. It truly is a wonderful situation to be in.
If you are interested in receiving timely updates on the portfolio, reasoning behind our additions and deletions, you should consider subscribing to our private Substack. You will receive regular intra-week updates on the credit portfolio and beginning of March’23 we will start adding our best ETF pair trades.
CONCLUSION:
Another week in which I will avoid taking directional trades. Rather I focus on relative value again and trading pairs until I have a strong conviction of the bond markets’ direction. The beauty of pairs is that you don’t need to know where we go next, all you need to know is why instrument A should outperform instrument B. That approach really takes off a lot of pressure off my shoulders and I love it. You may be tired of my pair trading writings but this is what works now for me and I intend to do it until it stops producing the results.
FRIENDS OF HOTF
It is incredible difficult for those who are just starting to filter through the noise in fintwit. Thus, we have decided to include in this section people we follow closely as we believe they are from the few that know what they are doing.
Before moving onto the next part I want to give fx:macro’s newsletter a shout out. He is the very best in summarizing central bank’s activities and the most important macro events in the coming week. There is so much going on in the central banking world at any given moment that getting up to date without his publication will be impossible. Highly recommended.
EQUITY MARKET REVIEW
General overview: Last week was a tiny bit of a rollercoaster. Bidders were failing to show up in the first half of the week and all gains were quickly faded. All this came a bit surprising giving the good technical levels that the index was on and the oversold conditions at the time. And then, as a trader on the floor put it, the market did the most obvious thing, holding the 200 daily moving average. This time, the market saw Bolstic comments as something to hype onto. It is to be noted that he is not a grand figure in the big picture of things and the fact the market did that only comes to show that it was looking for something as a catalyst, after which came the usual comb - a bit of squeeze and vanna and charm flows plus short covering on Friday.
I have been saying for most of the past week how bullish the charts are looking and will say that again. I know where terminal rate has got and contrary to my belief that this cannot be good for the stock market I have to say that a chart looking like this deserves every ‘bear’ to stop and think.
Strict trend up from the low without even a hunt for stop losses (below sma200d). What made a great impression on me is the fact that the larger wage growth than anticipated (which was supposed to be the scariest thing for bulls) was so well digested that it made me post this on twitter (pardon for the double chart).


All of this resilient price action last week was happening while the yield curve was moving up across all maturities. It reminded me that of what went on near the October lows, when the US20Y was going parabolic but equities had already put their sunny hats on and ignored it for a couple of days until it finally retraced. Similarly, on Friday the very feared long-end came down giving relief to those willing to buy equities.
At the same time, the December 2024 contract eased off too and the DXY is currently digesting the recent move up, which provide further tailwind for a move up.
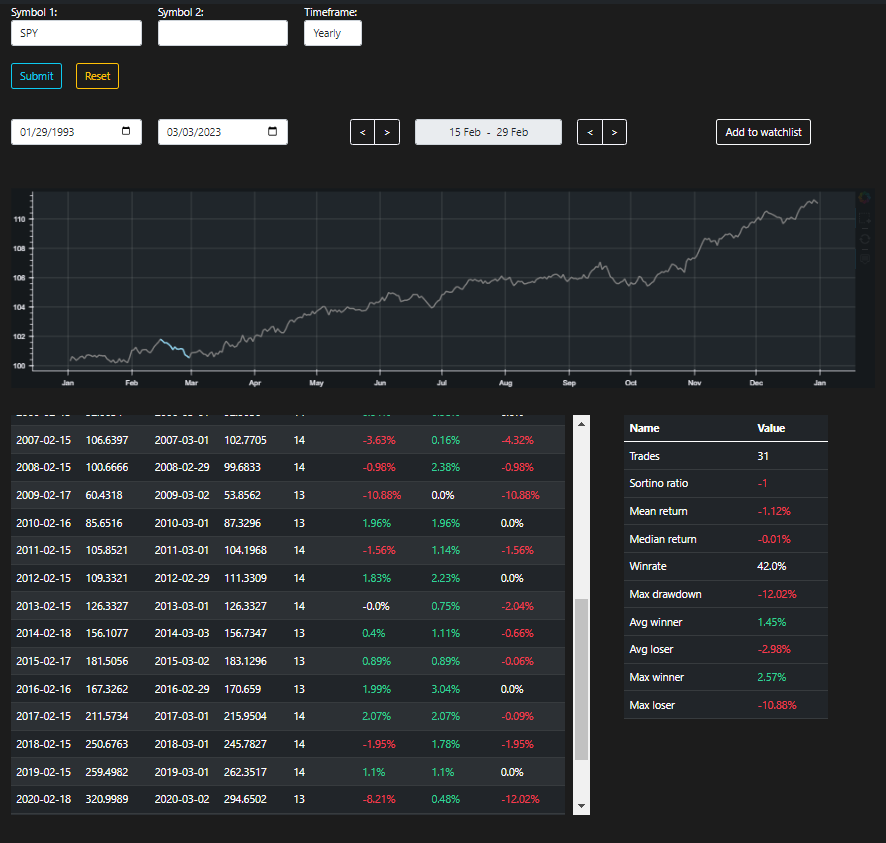
I was bearish at 4200, neutral in the beginning of last week and now I get some bull vibes in me for the short run. I know fundamentals make stocks not cheap and this is fine as long as I am eyeing a short move. To finish off why I have flipped my short term view I will provide two more arguments. One is that the second worst seasonal time for the SPY is now behind our backs (first one is second half of September but the difference in performance is very mild).
The second argument that makes the water even murkier for a bear case, came from one of my favourite guys - Brent Donney (@donelly_brent) and is summarizes here:


Spending so much time above sma200d is definitely atypical for the bear markets in the last 70 years. I think we are gonna spend some more time before eventually crossing it from above.
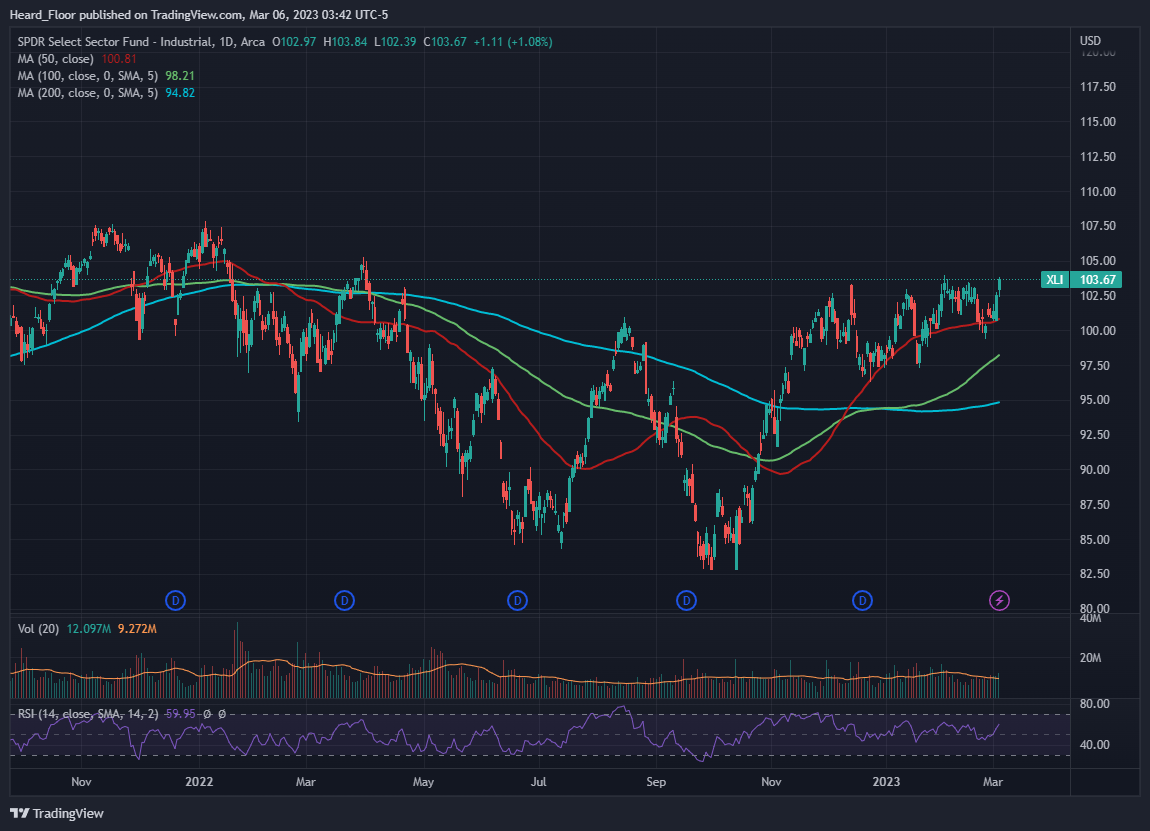
Sector overview and potential trades: Just as the general market has this beautiful chart lined up for a move up, so do most of the other sectors. Those experiencing relative strength such as XME, XLB, XLI are all near recent highs and buying at resistance is often a poor choice.
What is more, they look mightily extended to the upside which requires one to sit down and wait for a proper entry. To be honest, I would do the same with SPY as after a two day run-up I think it deserves at least a break. I kindly remind everyone that this week we have Powell, ECB and Jobless claims so everything could flip according to how those come out to be. However, unless something in the rhetoric really changes, one might pick some longs on a sell off.
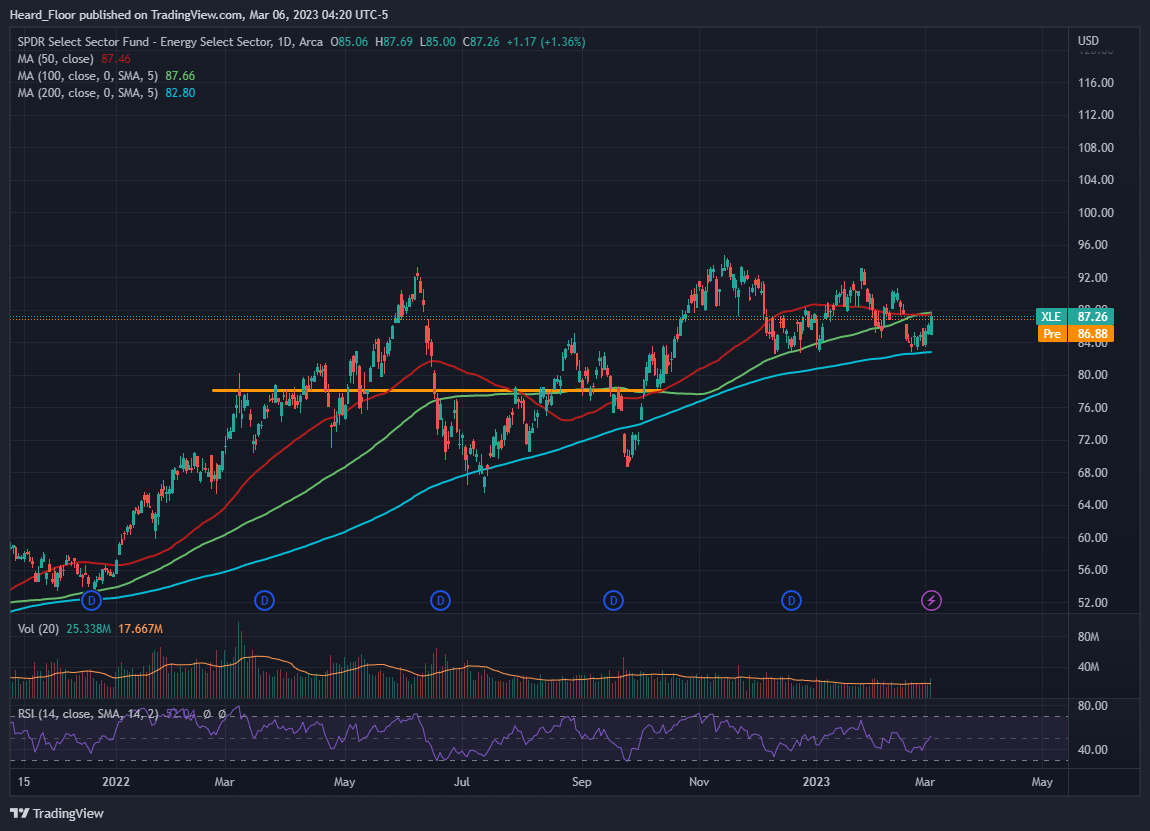
On a side note, I am curious to see what oil and the energy equities are up to. On Friday WSJ came out with news that UAE is thinking about leaving OPEC, which would allow it to increase oil output. Naturally, oil gapped down. However, someone quickly bid it up and it ended up closing on the highs right near the 80$ resistance (also sma100d). Price has been consolidating in the 70-80$ range for quite some time and everyone knows there is the administration waiting to fill the SPR below that range, which makes it feel like the market has a sort of a “FED put”. I could hardly see the rest of the market going up and oil not participating. What is more, energy equities have now a bigger role in SPX (meaning they are larger beneficiaries of passive flows), participate heavily in momentum factor trading and are not sitting on bad levels from a technical point of view.
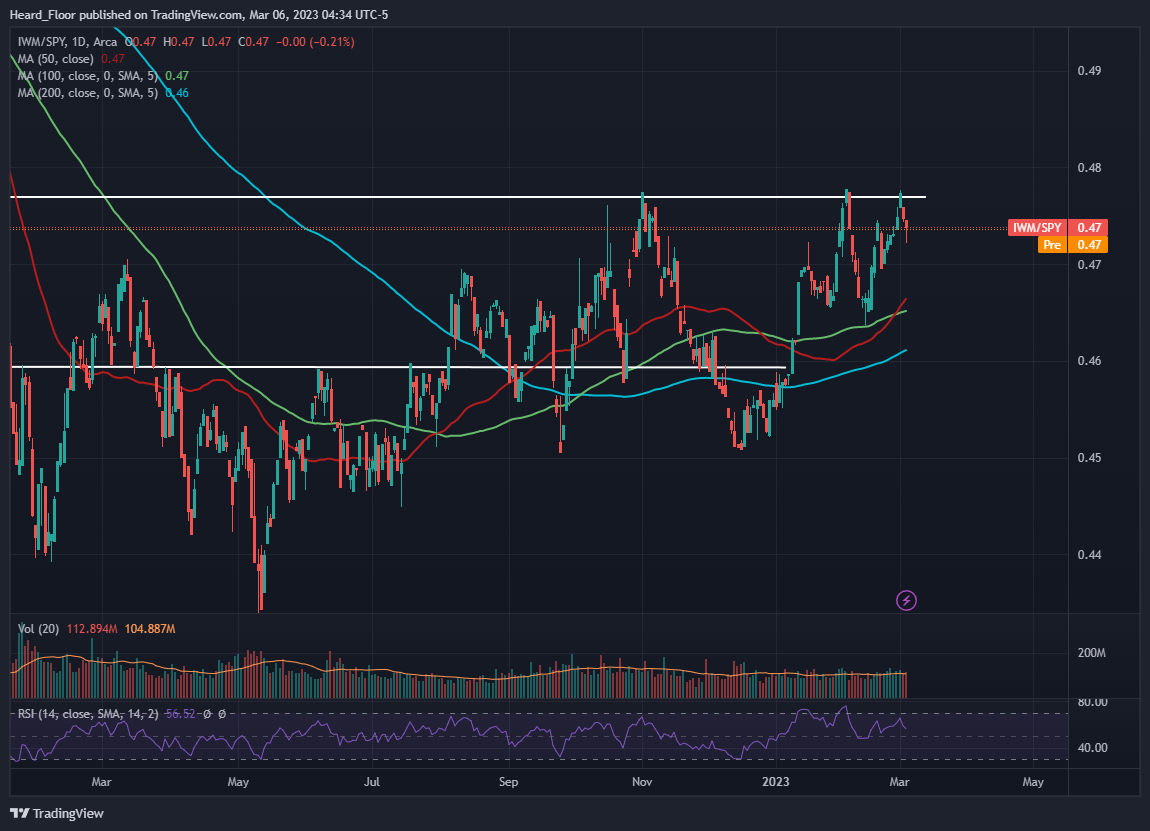
Current positions: I am long SPY vs IWM (2/3 risk) and short TSLA
On Thursday, seeing a nice pop in defensive names and getting a feeling where SPY was going to go, I got rid of the last bid of USMV vs SPY. As previously said, I think many of the megas are oversold and are about to be picked up. I ended up playing with long SPY vs IWM as the pair was right at resistance when I entered on Wednesday. On Friday I took profit on 1/3 of the size and I am keep the rest for now.
I am still short TSLA through a 31 Mar 190 - 150 - 130 put fly. I am currently flat on the trade and realize that it might hurt to hold if SPX is going up. However, as of now, I see no reason to change anything as it is 2 good days away from being in the money.
Conclusion: It is hard not to admit that the charts for the major indices and individual sectors look bullish. What is more, high rates, strong wage growth and inflation data have not managed to even remotely scare the bulls, proving demand to be very resilient. With SPX being out of the second worst seasonal period in a calendar year, the case for a move up appears attractive. This week we have Powell, Lagarde and jobs numbers coming out, which could mess things up.


