


Who said Europe is boring?
Credit Suisse brings the spot light to Europe 3.20 - 3.24.2023
CREDIT MARKET REVIEW
The Bloomberg app on my phone bombarded me with breaking news notifications about Credit Suisse this weekend. This week’s credit review will be focused on clarifying what all this means to us, the potential ways to gain exposure to the affected AT1s and what are the major DOs and DON’Ts in pair trading (relative value) in this very volatile environment.
Now, I am not going to pretend like I know what it all means or how the markets will be impacted but I will share what I’ve read so far and what my understanding of the situation is:
Credit Suisse will be bought at CHF0.50 by UBS.
CS AT1s going to 0, greatly impacting their holders. So far chatter on Twitter is that Asian banks are the biggest holders of CS AT1s. Market so far confirming that view as HSBC is down in Asian trading. This is the big thing happening, the big risk event and why the market is feeling very jittery this morning.
The weird part is that equity holders get a bit of left over value in this transaction while AT1s , which sit higher in the capital structure are wiped out. This is where I am not confident I know what is going on or why that happened. Seems like I am not the only one.


My style of trading does not involve reading the prospectuses of all instruments that I trade. Likely there is a perfect explanation of the whys about this event. Maybe a corporate lawyer can help us out in understanding the reasoning for this but I am certainly not one, however what I am certain about is that all European AT1s will be hit hard today on fear that this scenario may spread to other European banks. This is an article I found interesting on the topic from Bloomberg. Hope it brings clarity.
Looking at where the AT1 market is trading as of the early European open, I can conclude that the current market is in a massacre mode.

As you know, on our trading floor we don’t focus as much on trying to solve the puzzle but rather pay attention to what the price action is telling us. Friday was telling us that something was amiss. After all the actions of authorities to stave off a crisis the market was very weak on Friday. We’ve had SIVB depositors saved, we’ve had a lifeline equaling 53BN Swiss Francs provided to Credit Suisse by the Swiss National Bank and 30bn provided to FRC in the form of deposits by the largest American banks. The combination of these events conditioned me to believe that we are going to see a bounce in the short-term. Boy, was I wrong about that one.
Lets move on to the possible ways of getting access to the AT1 and Perpetual market via exchange traded products.
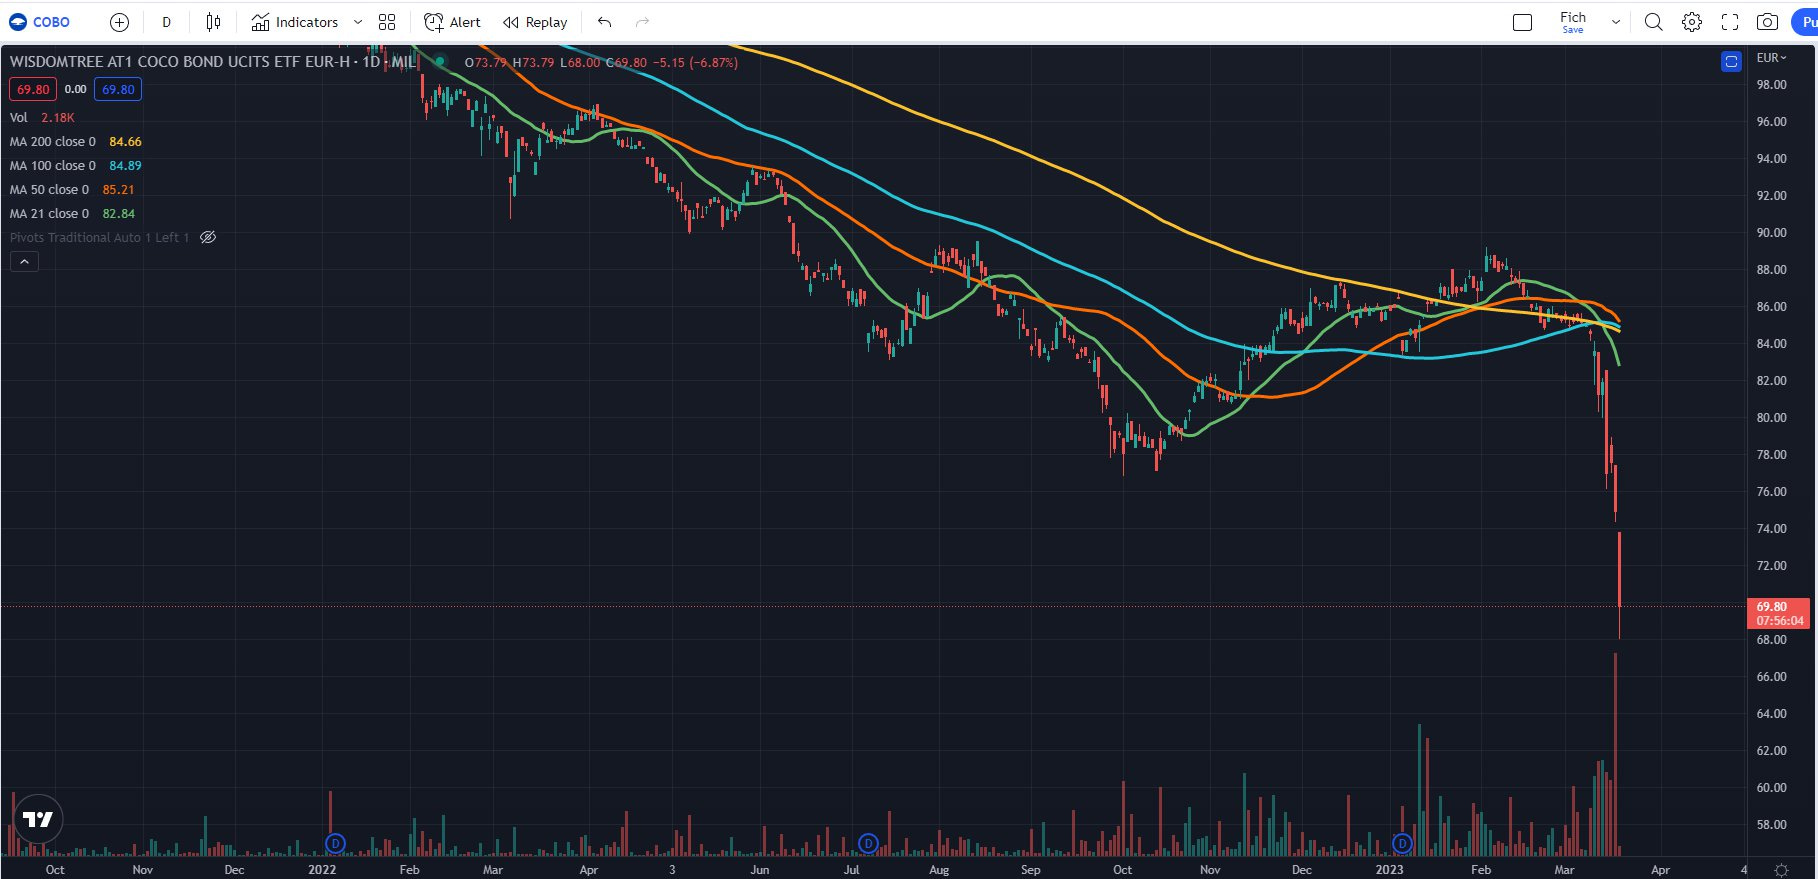
If you are interested in the AT1 market but don’t have access to the OTC markets you can trade $COBO (Wisdom Tree COCO Bond UCITS) in Europe and $FPE ETFs listed on NYSE. Constituents of the below mentioned ETFs are traded OTC but you can gain exposure to them via the above mentioned ETFs, which are all exchange traded. This makes them suitable for anyone not having access to the OTC markets.
COBO - EUR/USD/GBP AT1 constituents , traded in EUR market hours

FPE - USD AT1 constituents, Yankee banks mostly, traded in NY market hours.

VRP = USD perpetual preferred stocks, OTC traded, US banks mostly but if fear spreads to the US markets this ETF will also be hit.
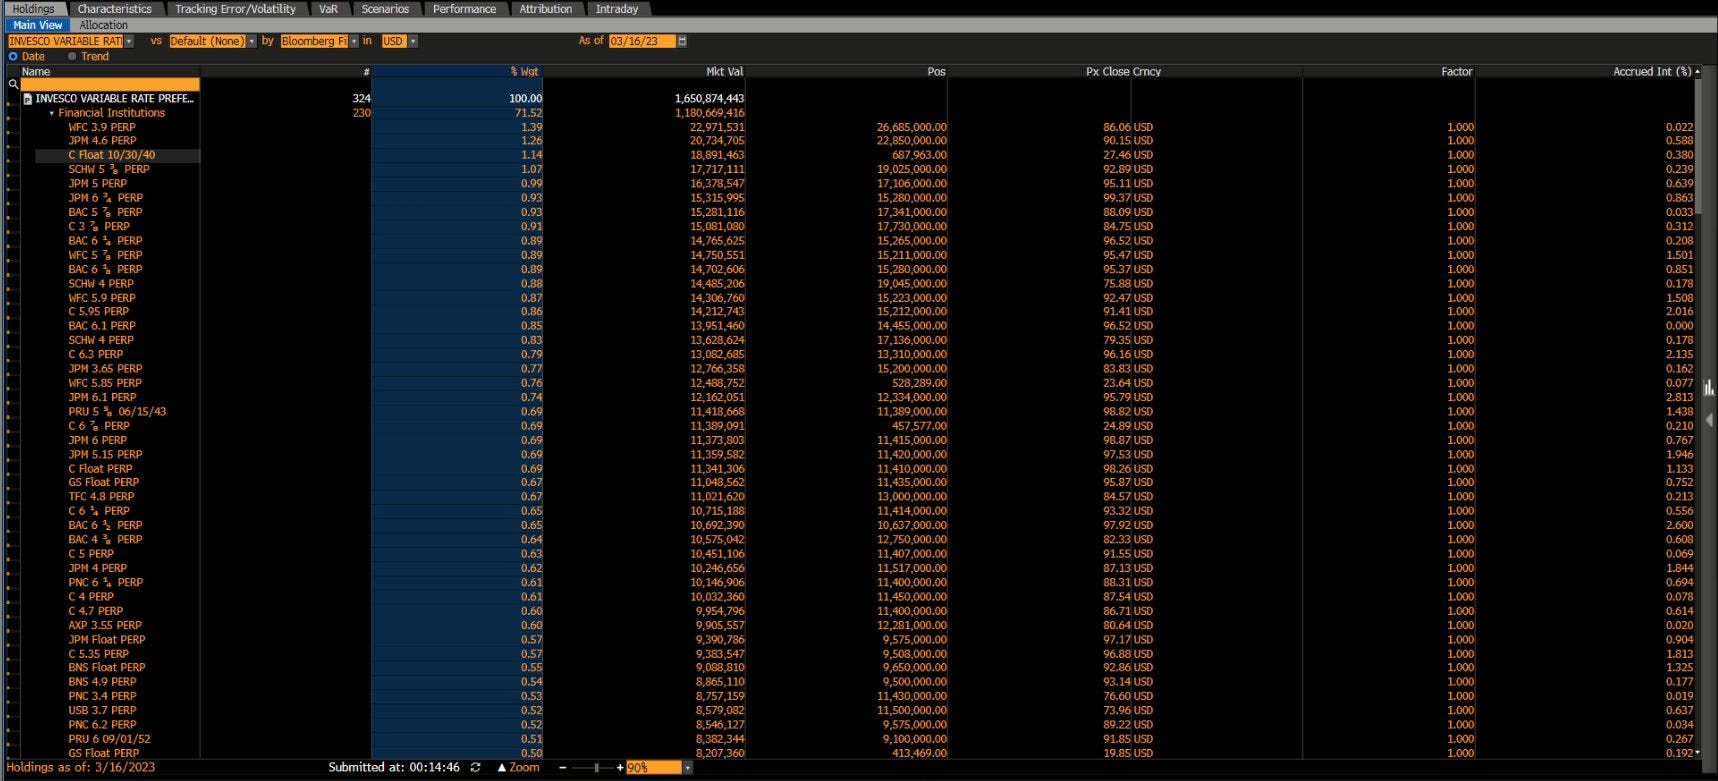
The screenshots do not represent the full spectrum of constituents, only the tops holdings by weight.


Other important ETFs to mention. PFF and PGX consist of $25 dollar par, exchange traded preferred stocks and as you can correctly guess, the vast majority of them being financials, aka large-cap and regional banks, like GS, MS , RF, KEY etc. Now my brain naturally pulls me towards pair trades but before we get excited about the opportunities in the sector I want to draw a few lines that I am not willing to cross from a risk point of view. Here are my pair trading rules in such events:
If you pair trade ETFs you should know what their constituents are. For example, Pairing FPE with PFF is certainly not advisable due to the major mismatch of constituents. FPE consists of USD denominated Yankee bank AT1s, whereas PFF consists of $25 par exchange traded preferred stocks. Different issuers, some of them affected by the Credit Suisse fiasco, others affected by the SIVB fiasco, and some not affected by any of these but still are down in sympathy. Eventually the good apples will be separated from the bad apples and the differences will start becoming obvious.
I wouldn’t do cross issuer pair trades even if we talk about the same tier debt in the capital structure. Said in plain English, I wouldn’t buy the preferred stock of GS and sell short a regional bank preferred stock, like KEY or RF. There is too much idiosyncratic risk that I don’t want to take.
I wouldn’t do cross capital structure arbitrage even if we talk about the same issuer. We all saw SIVB’s OTC perpetuals trading at 2c-5c on the dollar compared to their bonds which traded at 40c on the dollar at the height of the crisis. We’ve also seen what happened with CS’s AT1s compared to their bonds.
The type of pair trades that I like doing in this environment are between 2 instrument from the same issuer, from the same tier in the capital structure but are trading mispriced. This happens often in high volatile environments as people that need to cut risk/exposure to a given issuer or simply need to deleverage are ignoring the fundamentals of a particular instruments and all they care about is finding bids to sell to. This naturally creates the best pair trading opportunities that we so much love.
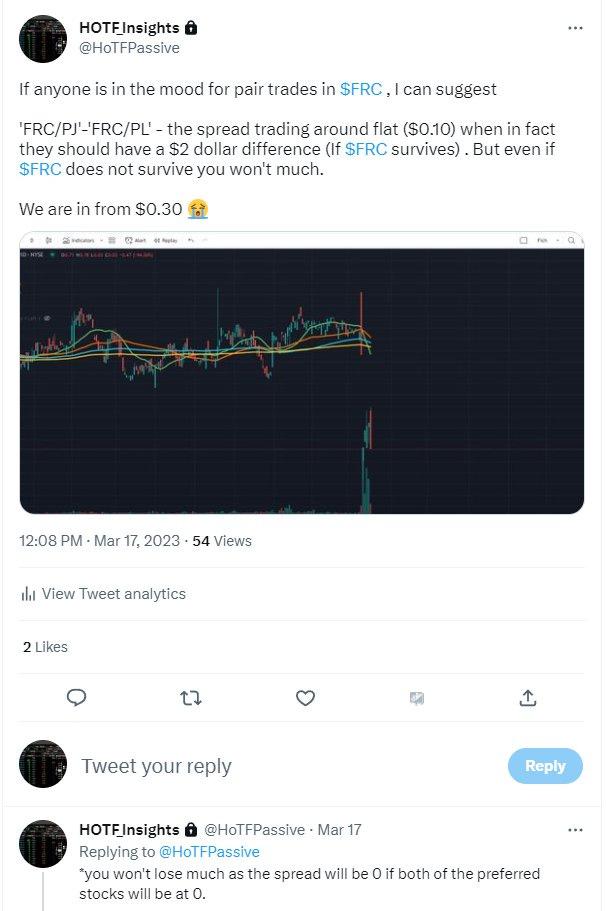
This trade in the FRC $25 par exchange traded preferred stocks might not work out given the prevailing risk with FRC but the risk in such a trade is limited to the price difference of the 2 preferred stocks. Obviously if FRC becomes insolvent both will trade at 0 (or close to). This means I lose the full value of my long in FRC/PJ and profit in the short FRC/PL position.
Let me explain the trade management in a bit more detail:
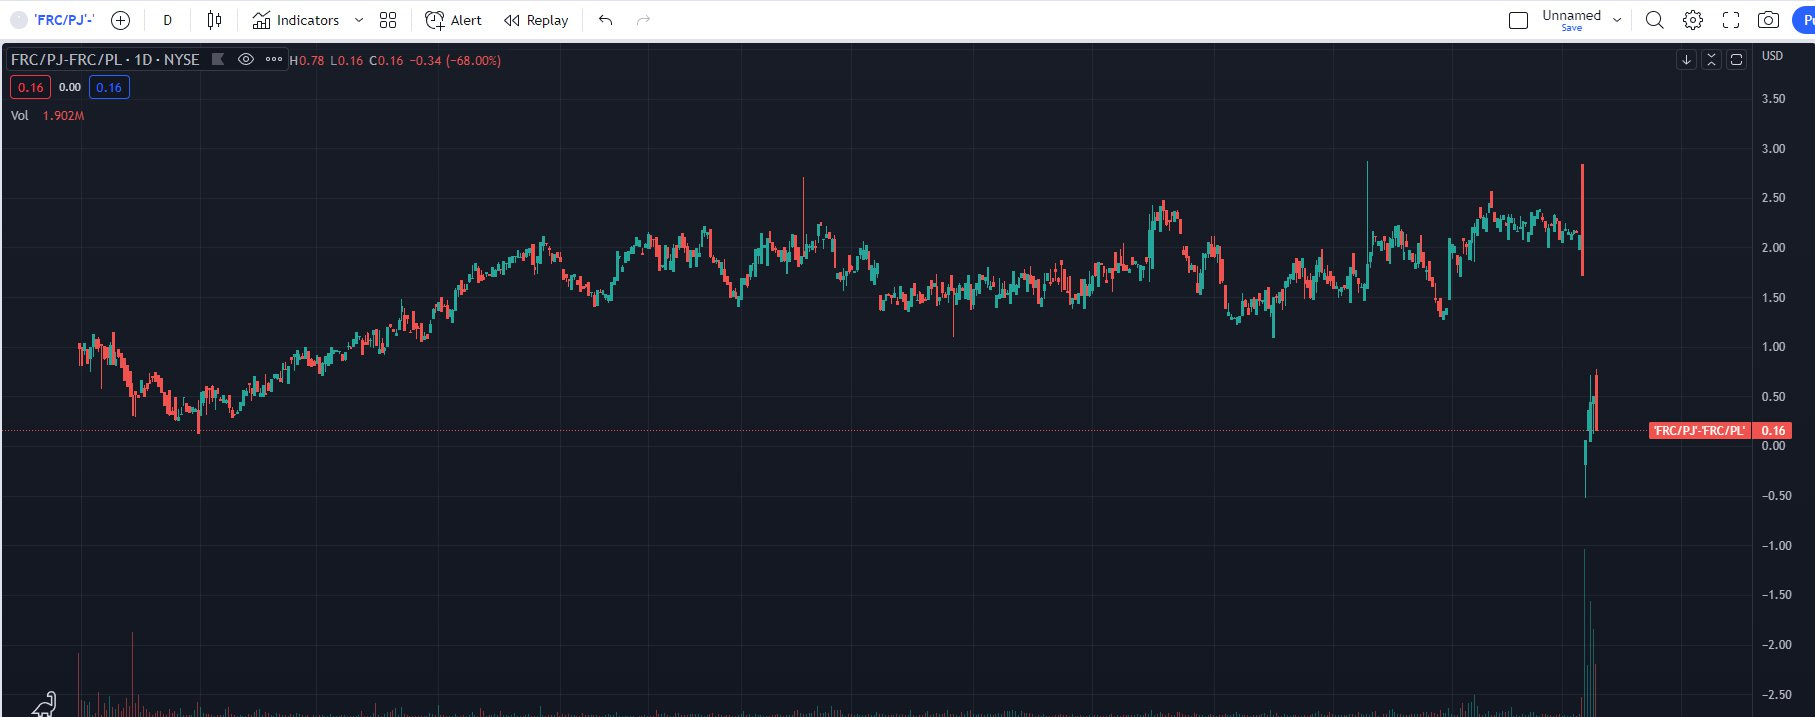
I had entered the pair trade position at $0.30 price spread (price of FRC/PJ - price of FRC/PL). If you want to see the trade in tradingview copy/paste the following into TV. (‘FRC/PJ’-’FRC/PL’)
My max risk is $0.30c minus the associated costs of holding the short position
My take profit level would be at $1.5 price spread , which equals to 4:1 risk reward in my favor. Risking $0.30 to make $1.2. (minus expenses)
WHY I LIKE THIS PARTICULAR PAIR?
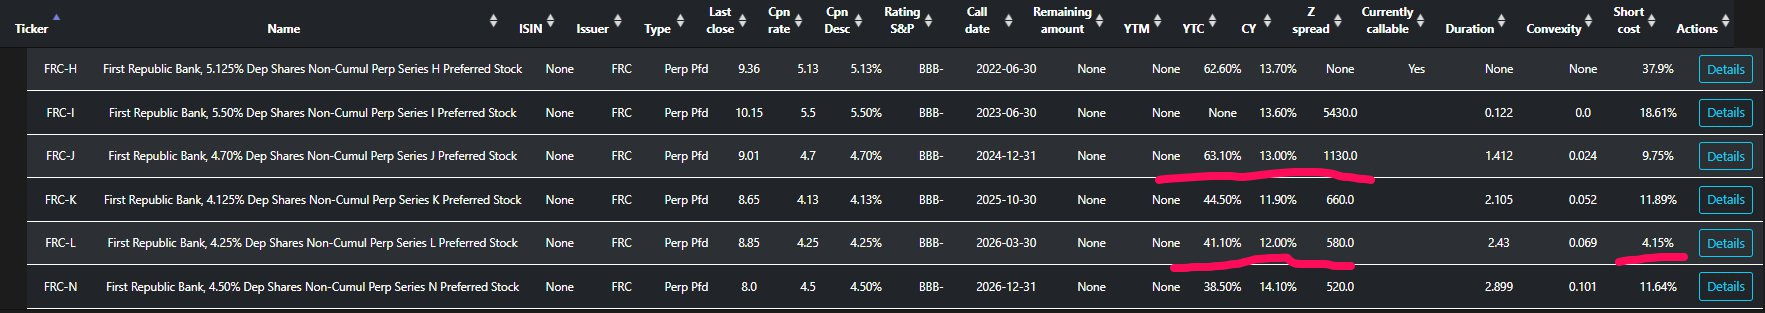
FRC-J’s call date is nearer compared to FRC-L.
FRC-J’s coupon is higher , which naturally leads to higher YTC and higher CY, on top of the shorter call date.
The borrow fee for FRC-L is only 4.15% pa which is considered low for exchange traded preferred stocks
The price spread chart between FRC-J and FRC-L is usually trading at a $2 price spread whereas we bought it at only $0.30c price spread. This spread prices high likelihood of bankruptcy and I am aware of that given the attempts by the big banks to save FRC , I believe there are good odds of survival. I am more optimistic compared to what the market is currently saying.
These are the type of trades I love doing in this type of environment and prefer mostly to sit on the sideline until similar trades start popping up. Believe it or not, in this environment I also prefer focusing on exchange traded instruments as the liquidity in the OTC market is beyond ridiculous and often I get no bids whenever I am looking for one. I’ve had this issue with several of the OTC perpetuals that I am trading.
As usual, if you find this type of trades interesting and want to see more of them alongside with our other trades, you may consider subscribing to our private Substack.
FRIENDS OF HOTF
It is incredible difficult for those who are just starting to filter through the noise in fintwit. Thus, we have decided to include in this section people we follow closely as we believe they are from the few that know what they are doing.
This week we present you a guy from the beloved Fixed income space. Great content and a must follow. This is one of the publications I make sure I read every weekend. Best of all, it is free.
Bond Blogger's Credit Wrap is focused on informing readers of the main happenings in the Global Credit Markets in a quick and simple manner. Topics covered include Govt Bonds, Inflation, Investment Grade, High Yield & Distressed, Sub Financials (incl AT1), EM, Ratings activity, Private Credit and Credit Trading. The author has worked in Credit Markets for over 10 years and has experienced a number of major market events such as the Oil & gas bankruptcy patch, 2018 tightening, 2020 pandemic and Russia/Ukraine war and high inflationary period.
EQUITY MARKET REVIEW
General overview: Last week was something to remember. VIX was doing yo-yo moves in the range of 22 - 30 and the news coming felt like really big stuff is brewing and the market is about to crack any given second. Yet, price action was rather contained and the major indices were more than resilient. While financials were melting down amidst a bank run on the regional banks, SPY managed to close 4 out of 5 days higher than it had opened. This is truly remarkable, give that session time is when the big guys find the liquidity to act and adjust their books accordingly.

All this led to SPY closing a 1% positive for the week and c. 1.5% if you adjust it for dividends (Friday 17 was ex-div day for SPY). It is truly remarkable how the market managed to do this. The main reason we did not see a complete massacre was the massive rotation into tech stocks, mostly the mega caps, which due to their huge weight held the market steady. This is obvious when one has a glimpse on QQQ, which scored a massive c. 6% week and closed near highs marked in the beginning of February.

The weekly sma200d held perfectly. The whole move up was driven by the huge drop in rates, where I believe speculators were being ran over on their short bond bets. Rates fell all across the curve but it was the short end that made everything else pale in comparison by erasing several months of activity in a week.

Finally, the steepening trade started working in full force, as the move in the back end looked rather benign compared to what was going on in the front end.

The market quickly grabbed their chance of trying to push the narrative of ‘no more hikes, rather cuts’. Not only cuts are projected, but they are expected to be a fact by Jun 23, according to the SOFR3 June futures, implying a rate of c. 4.3% by that time.
Not only did lower rates boosted the valuation of long duration assets (to be read tech stocks), but also the dollar seemed to be lacking all the risk-off vibes the real economy sectors had. It is no news that the major losers from a strong dollar are the big international businesses (mega caps, again). In this sense, the rotation from real economy stocks to big tech was well backed from a fundamental point of view.

I am left with the opinion that the regulators are not lagging with the crisis that is unfolding and are actively working on containing the issue. The market seems to be experiencing bipolar activity with the enormous rotation that is going on but as a whole is far from panicking as there is no major deleveraging across all assets.
Going forward I will be watching how the market digests the efforts put into keeping things glued. So far so good, but one should realize that we are pricing here what I think is a best case scenario of no major equities drop, panic relief and inflation & rates not being a worry anymore. It sounds a bit of a fairy tale to me.
Sector overview and potential trades: I will again, try to omit the obvious comment on KRE and XLF. I just want to point out what has already been said many times but is truly important. Higher funding costs for those that survive will ultimately hit the economy and cool it down. Commercial real estate is entering this crisis in a very weak shape and is going to be one of the sectors that would be most effected in the long term by the turbulence in banking. It should not be a surprise that such real state companies (BXP, VNO, ARE, OPI) are making new lows.


I have briefly expressed the bipolarity of the market above with real economy sectors being for sale, whereas everything in the QQQs catching a bid. This was couples with a huge inflow into mega caps and has led to big divergences across sectors and market factors.
Value, momentum, high dividend yield and small size factors all have one thing in common - they are full of real economy stocks such as banks, energy, healthcare, etc. Look at how they had performed relative to SPY during the last week.


There is one big mean reversion trade that is setting up and it feels like catching a knife. One just has to pick his poison. To be honest, I am looking at all of them with my eyes mainly set on an equally weighted version of the SPY (RSP) vs the SPY itself, which is market cap weighted. I think the sector rotation has gotten a bit too far too soon.

Current positions: I am long MET and AIG through call spreads (half risk in total) and also short NVDA (half risk) through put spreads
Last week I wrote about various gold trades that made a lot of sense. Unfortunately, the market opened higher for all of them and did not look back.

Sometime into the week I got tempted to buy insurance companies as they got sold off due to their investments in both treasuries and equities of other financial companies. Feeling that catching a knife in such volatility environment is only sensible through options I got MET 57 - 60 and AIG 49 - 53 call spreads expiring March 24. I have paired that exposure with a NVDA 250 - 240 long put spread for April 6 after that beautiful pin bar on the gap up it did on Friday.


Conclusion: Last week was much more than it seems if one looks at the SPY. A huge sector rotation from real economy sectors to long duration equities (mainly tech / mega caps) has led to wide divergences between factors (momentum, value, size) and the general indices. The market also appears to be pricing no major stress for equities as a whole with rates and inflation no longer a problem. A scenario that is a bit of a wishful thinking with the underlying tension going on.